Yes the config is formated in the web editor.
Sorry the formatting was removed when I pasted it here in the forum
very strange.
i check in the web inspector of firefox.
the config parameter of period is actually applied in the url. Means the {periode} is replace with the corresponding time range.
i also checked with the standard web widget in OH3 UI and added the non embedded URL. here the time range adapts.
seems to be a issue only on the embedded link of grafana
Try removing %2B56h from the URL. This looks strange to me.
this i tried already and it had not influence on the time switching
As i like to visualize data in the future an add 56h
“+” is not accepted ad character that’s why it is %2B
once again the replacement of period is working. the selected time range is visuable when I investigate the html of the OH UI.
I guess it must be something in grafana then
What do I need to do, so I can display Grafana dashboards without login?
edit grafana.ini:
[auth.anonymous]
# enable anonymous access
enabled = true
Then restart grafana.
Ok sounds logic to me, but by setting this, my whole Grafana environment will be accessible without password? Although it’s only available from my local network, this doesn’t sound very secure.
I will give it a try.
Did it work?
no still the same message. I also checked if allow_embedding was turned on, but this is also the case.
What version are you using?
I am on 7.5.2.
I have just upgraded grafana to 7.5.7 and it is working OK.
Just to test:
If you have a web page of grafana that works in a browser you can copy that url and put that into the widget just to test the widget.
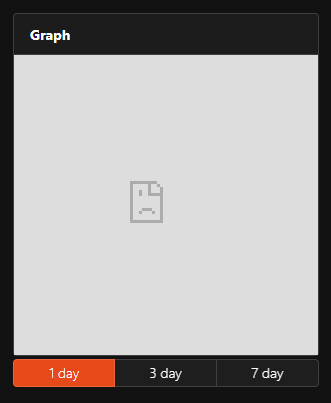
You have to also put the time range options in as well otherwise the widget won’t work and you will see the content is blocked screen.
If this works then you should be good to get the syntax of the time ranges to work.
Below is what I mean:
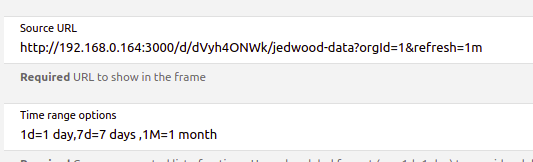
The url I used is one that works in the browser.
Good luck.
I’m on 7.5.3
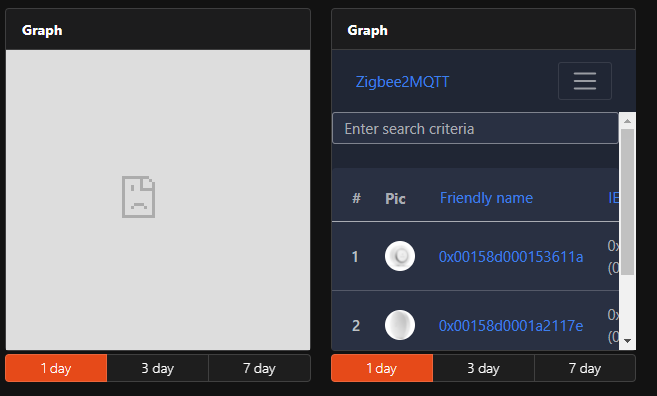
I can open this page without any issues in my browser http://192.168.0.4:3000/d/6gOBMstMz/overview?orgId=1, but not working in the widget.

I also tried it via a oh-webframe component, I can show eg my zigbee2mqtt dashboard, but not Grafana.
In the grafana.ini did you also set:
# set to true if you want to allow browsers to render Grafana in a <frame>, <iframe>, <embed> or <object>. default is false.
allow_embedding = true
And then restart grafana.
I had this line in my .ini file, but my docker container wasn’t using this file… no everything works fine! thanks
Hi,
Great widget!
How could I add a ‘previous’ and ‘next’ button to the time periods?
For example, I’d like to look at 1 day range, but skip back and forward days
Hi Marcus,
thank you for the widget. I am one step closer now.
My goal would be to replace the OH3 Graphs with Grafana.
Right now i have a labeled button:

and when I click on it the OH3 chart is displayed on the available screen:

I have modified your widget to:
component: oh-label-cell
config:
  title: =props.vTitel
  icon: oh:chart
  item: gHeizung_Stellwerte
  trendItem: Heizung_Vorlauftemperatur_Ist
slots:
  default:
    - component: oh-webframe-card
      config:
        borders: false
        class:
          - display-block
        footer: =props.footer
        height: =props.height
        noBorder: false
        outline: true
        src: =props.URL.replace('{period}', vars.selectedPeriod || [props.timerange.split(',')[0].split('=')[0]])
        title: =props.title
    - component: f7-segmented
      config:
        outline: false
        round: false
        style:
          --f7-segmented-strong-between-buttons: 5px
          --f7-segmented-strong-bg-color: rgba(255, 255, 255, 0.05)
          --f7-segmented-strong-button-font-weight: 300
          --f7-segmented-strong-button-hover-bg-color: rgba(255, 255, 255, 0.07)
          --f7-segmented-strong-padding: 0px
      slots:
        default:
          - component: oh-repeater
            config:
              for: size
              fragment: true
              sourceType: range
            slots:
              default:
                - component: oh-repeater
                  config:
                    for: period
                    fragment: true
                    in: =[props.timerange.split(",")[loop.size].split("=")[1]]
                  slots:
                    default:
                      - component: oh-button
                        config:
                          action: variable
                          actionVariable: selectedPeriod
                          actionVariableValue: =props.timerange.split(",")[loop.size].split("=")[0]
                          fill: "=(([props.timerange.split(',')[loop.size].split('=')[0]] == vars.selectedPeriod) || (props.timerange.split(',')[0].split('=')[1] === loop.period) && !vars.selectedPeriod) ? true : false"
                          outline: true
                          round: false
                          style:
                            --f7-button-border-color: rgba(255,255,255,15)
                            --f7-button-border-radius: 5px
                            --f7-button-border-width: 1px
                            --f7-button-fill-hover-bg-color: rgba(var(--f7-theme-color-rgb), 1)
                            --f7-button-font-size: 14px
                            --f7-button-font-weight: 300
                            --f7-button-padding-horizontal: 0px
                            --f7-button-padding-vertical: 0px
                            --f7-button-text-color: black
                            --f7-button-text-transform: none
                          text: =loop.period
When clicking the button it looks:
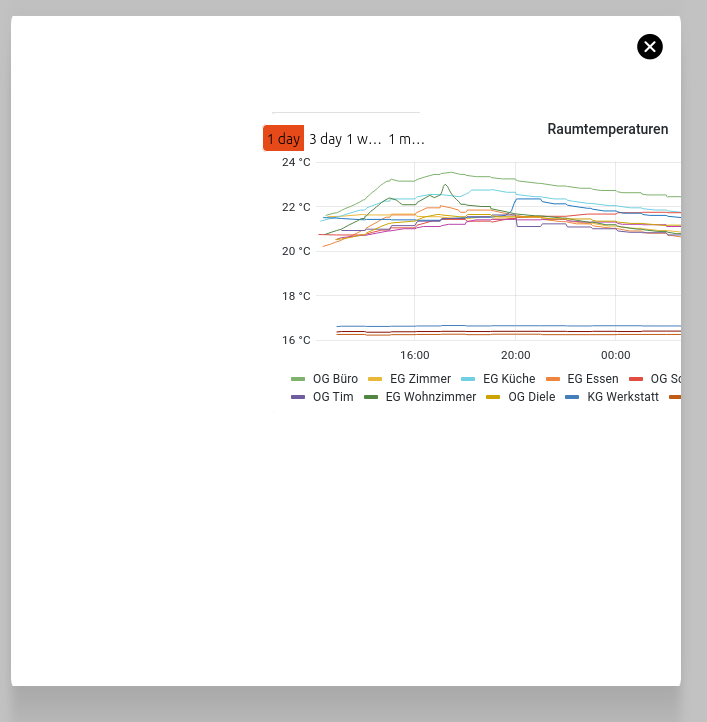
So the main difference to the OH3 chart is that the popup is not covering the full page, the grafana chart is not in the centre and for any reasons the select buttons are above the graph.
Do you have an idea on how to proceed here?
Thanks
Marco
Hi Marco,
I suppose that the problem is related to
whereas I am using
Need to state that I’m not a f7 expert at all - lots of trial and error when I built this widget.
Good luck!
Marcus
Not sure this is easy to implement.
You might want to take a quick look here:
It is using 1:1 the logic from grafana e.g.:
from=now-1d&to=now
… maybe something to get started with and add some code to make this work for you.
My skills are not sufficient to do this. Maybe someone else can help.
Please share your code once implemented. Thanks!
Good luck!
Unfortunately trial and error is my approach too when it comes to widget design ![]()
Hopefully someone with more skill jumps on this topic.
BR
Marco