I actually just dropped the DB and the data is flowing into Influx and Grafana now. Clearly I either did something wrong in setting up the RP or RP is not compatible with Grafana. The former is the most likely. I’ll pound on it some more later today and see if I can make it work. For now I can say that what I did above clearly does not work.
Even though we are not talking about a whole lot of data in size (I have it pretty well constrained to just a few Items anyway per my persistence Design Pattern), I like the idea of never needing to do maintenance of the DB even a decade from now. But I might just have to give up on that. After about 8 hours of storing data my DB is about 2.6k. If I project that I’m looking at only around 2-5 Mb for the year. I can live with that.
Still, I don’t like leaving problems like this unanswered.
extremely well written write up! I was just working on setting this up following the instructions from each application separately but yours was so much nicer written and all in one place, that made it so much easier. Also, I’m in love with grafana
Here’s what I’ve got after a couple minutes of finally getting openhab talking to my PLC properly - http://i.imgur.com/nCnVAef.png
Looks so much better than what I was using before!
I got this to work and am rather happy with it. I thought I would post some cliff’s notes on what I did for those who may want to go down the Docker route.
I installed both InfluxDB and Grafana using the official Docker images from Docker Hub:
docker pull influxdb
docker pull grafana/grafana
I next configured them both to run as a service. I do not recycle containers (i.e. a new container gets built every time the service starts) so I mount the config file and a path for the InfluxDB and Grafana database files. Also, as a lesson learned I had to mount /etc/localtime to the containers to make the graphs generated by in the right timezone.
NOTE: I had permission problems when I tried to mount the grafana.ini file ro which I haven’t resolved so I mount it rw as you see above.
Because I’m running in Docker, it was easier to use the web admin interface for InfluxDB instead of the cli interface. The commands are identical to @ThomDietrich’s above. However, there is a way to run the CLI, see the notes for the Docker image on DockerHub.
Grafana is supposed to support passing in changes to the config via environment variables rather than needing to mount the ini file but I couldn’t get it to work.
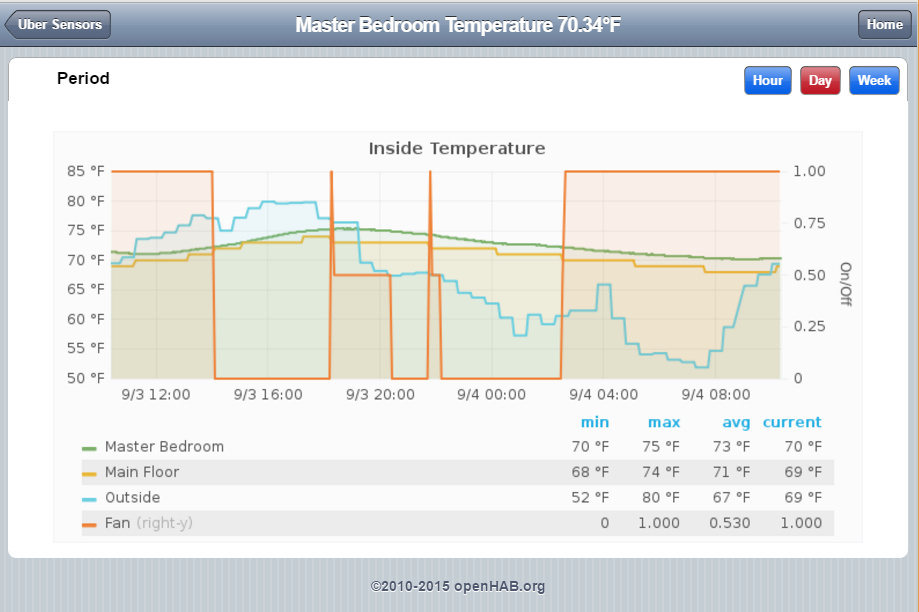
Creating the carts themselves is pretty easy. To put two Items with different scales (e.g. a Switch and a Temperature) on the same graph, you can configure a right hand axis and then move those Items to the right hand access by applying a Series Override in the Display tab.
To discover the panelID and see the general format of the URL to the chart press the Label of the graph, choose “Share” and select “Direct Link” at the bottom. This will open just an image of that chart in a separate tab.
I have been wanting to set it up since I first heard about grafana.
You’re post gave me the final push that I needed.
Now I am amazed by the graphs. It’s almost ridiculous how good looking they are!
I think you can invert the values in Grafana itself on the Display tab as a custom series parameter like you would do to assign a series to the right y-axis. I experimented with it trying to come up with a graph with my RFM69 gateway transceiver’s temperature with the RSSI so I can see if temp is affecting my signal strength (it is). In the end leaving it not inverted worked better for me. I’ll post some screenshots when I get home, though they are really boring.
Edit: My graphs so far. NOTE: I probably will never use Grafana’s dashboard so this is how I’ll see them in my day to day use.
Inside temps verses outside temps and switch indicating when the central heating fan is on (I’m hoping to prove to myself that running the fan does equalize the temps across my three floors (NOTE: I’m still wiring and coding up the sensor for the basement).
Inside Humidity verses outside humidity. This will become more important in the winter as the winter humidity here stays between 15% and 20% and I like to keep at least the bedrooms at 35%. A whole house humidifier is in the plans at some point.
Light levels. More sensors are in the works. Not sure exactly what I’m going to do with this beyond using the graph to help determine when to turn on/off the lamps instead of the weather.
I’ve created an RFM69HW gateway on a Raspberry Pi and I created one so far “Uber Sensor” from the Uber Home Automation Indestructible. This graph is telling me the temperature reported from the transceiver on the Gateway verses the signal strength reported detected when the sensors communicate with gateway. I admit I don’t know much about wireless but an RSSI of -95 to -85 seems pretty poor to me and it fluctuates. I’m hoping I’ll be able to see some correlations on this chart (e.g. I’ve already seen signal strength goes down when the gateway temp goes up). This is probably my most actively used graph right now.
I have solar evacuated tubes providing hot water heating. The controller for this system has a series of temp probes which are housed inside 3 ports in my solar hot water ready HWC. I have just wired up an Arduino to measure the resistance of those 3 probes parasitically from the solar controller and report the temps to openHAB via MQTT.
It is basically just a series of holes punched in the side of the cylinder with a little plastic tube. It just bridges the gap from the cylinder shell into the internal cylinder. Then you can poke you temp probes down the tube so they rest against the inner cylinder and get an accurate reading.
They are pretty standard here in NZ for these types of the solar hot water installs I believe.
I think I did not express correctly what I want to display.
Having three values, I want to display the subtracted value with two graphs in one window.
e.g.
Value 1 - Value 2
Value 1 - Value 3
@Udo_Hartmann: There is a Math-Function in Grafana which allows to multiply with a factor (check the math - function in the query). Also stacking does not allow to display two graphs.
@rlkoshak: Can you elaborate how you did it with the second y-axis? Unfortunately I can not find it.
@MikeD: I think the holes for measurement are pretty much standard, too.
Let me answer that. I’ll make sure to mention it above (when I next find the time -.-). There are two options. The first is as easy as pressing the colored bar in the legend of the graph:
The second option is to create an override (which is actually quite useful for other options too):