InfluxDB+Grafana persistence and graphing

Ah you also found it. Thanks for pointing out that problem! I’ve updated the article.

With this great guide, I have nice graphs, however, I’m struggling getting the image in oh2 to work.

I have oh2 and influxdb+grafana running on a linux (gentoo) server named ‘xenon’.
I have setup a reverse proxy on this machine using the also great guide here; thread
(I don’t think this is part of the problem now, since I’m initially just running the grafana graphs directly here at home (xenon:8080/basicui/ etc ), but who knows - I’m out on deep water here.)

I have triple checked that I have anonymous enabled in grafana ini file.

I run all tests on my desktop.

If I go directly to the link from “Direct link rendered image” I get the image. In my case;

http://xenon:3000/render/dashboard-solo/db/nydashboard?from=now-24h&to=now&panelId=2&width=1000&height=500

But when I inser this into my sitemap accordingly;

Image refresh=60000 url="http://xenon:3000/render/dashboard-solo/db/nydashboard?from=now-24h&to=now&panelId=2&width=1000&height=500"

… I’m left with a broken image.
If I right click on the broken image link, and select “open in another tab” (Mozilla), I get;

HTTP ERROR 504
Problem accessing /proxy. Reason:
Gateway Timeout
(jetty)
Could it be that the image generation, which takes some time, takes too long time? I’m not sure
In the grafana log, I see;

t=2016-10-16T16:08:14+0200 lvl=info msg="PhantomRenderer::renderToPng url [http://localhost:3000/dashboard-solo/db/nydashboard?from=now-24h&to=now&panelId=2&width=1000&height=500]"

And finally, in oh2 log, I receive this line;

16:13:29.229 [WARN ] [thome.ui.internal.proxy.ProxyServlet] - Proxy servlet failed to stream content due to a timeout

Any suggestions welcome! :slight_smile:

Correct, if you’re running through openHAB’s 8080 port directly then then I doubt the reverse proxy server will be affecting your results.To completely eliminate this as a potential cause, you can simply disable nginx service (sudo service nginx stop) test what you’re doing and enable it again (sudo service nginx start).

Of course! Why did I not think about that! :slight_smile:

This made no difference though, so we can put that out the way.
However, I timed the time it takes for a graph to show when I put it directly into the browser, and it is somewhere around 7 seconds - very long time, considering this is on a core i7. Even if I do “now-1m” to “now”.
The timeout I get in oh is arriving in about 4 seconds…

I am more and more thinking this is the reason?

I can not speak for possible effects by the proxy but as @Benjy already stated, I can not think of one.

Are you sure this is done in a browser without authentication? Could it be a connection problem? Could you try the IP address instead of the “xenon” hostname. Please try opening the image on your OH2 machine: expecting a Linux system you could do this by downloading the image with wget http://...

Good luck!

I’ve just got this up and running and have encountered the same issue as you @vespaman

I don’t have a reverse proxy set up, but am running openHABian fwiw. I have triple checked my login settings match those set out in the guide, but still no image actually loads.

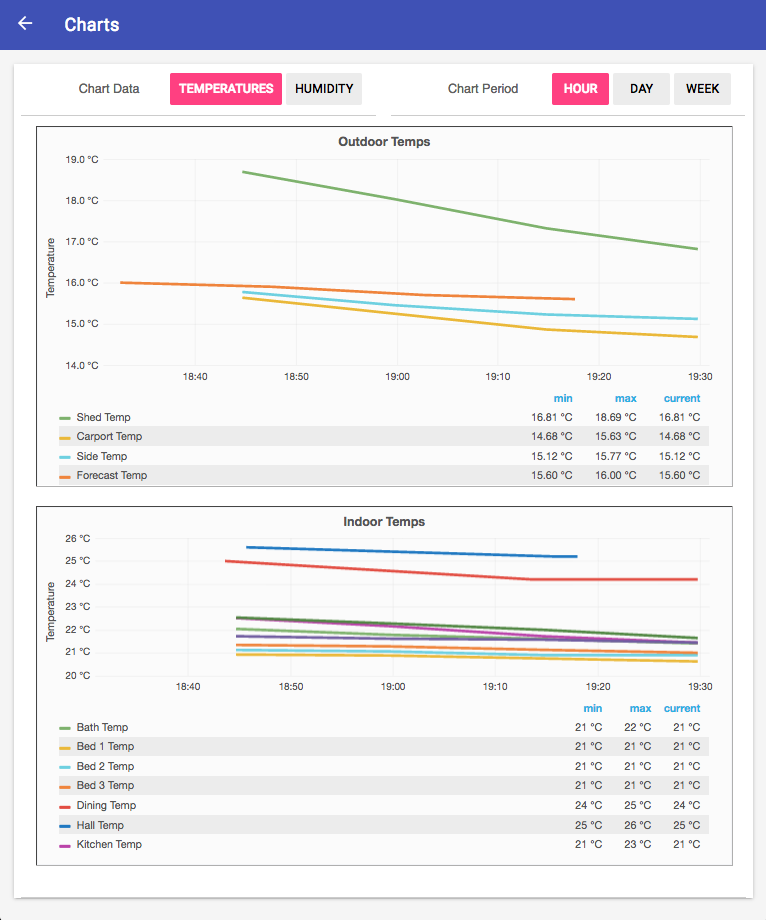
As a workaround (a better option @ThomDietrich?) i’ve set up a few html pages with iframes to the graphs. And not only does it work, it loads pretty quickly on my Pi3 and has some of the interactive elemnts of the original grafana graphs. Just put the html files and charts.css in the conf/html folder and it’ll all work fine. He say’s while crossing his fingers…

chartsDay.html (Also have chartsHour.html and chartsWeek.html)

<!DOCTYPE html>
<html>
<head>
        <meta http-equiv="Content-type" CONTENT="text/html; charset=utf-8">
        <link rel="stylesheet" type="text/css" href="charts.css" />
</head>

    <div class="container">
        <iframe src="http://192.168.1.20:3000/dashboard-solo/db/environment?from=now-1h&to=now&panelId=1"></iframe>
    </div>
  </br>
    <div class="container">
        <iframe src="http://192.168.1.20:3000/dashboard-solo/db/environment?from=now-1h&to=now&panelId=2"></iframe>
    </div>
</html>

charts.css

.container iframe {
  width: 100%;
  height: 400px;
}

.container {
  width: 98%;
  margin: 0 auto;
}

h2 {
  text-align: center;
}

Sitemap

Text item=Charts icon="calendar"{
    Switch item=weatherChartPeriod label="Chart Period" mappings=[0="Hour", 1="Day", 2="Week"]
    Webview url="/static/chartsHour.html" height=33 visibility=[weatherChartPeriod=="0"]
    Webview url="/static/chartsDay.html" height=33 visibility=[weatherChartPeriod=="1"]
    Webview url="/static/chartsWeek.html" height=33 visibility=[weatherChartPeriod=="2"]
} 
 //height varies based on number of graphs and dimensions of them. 

The height of the iframe is a bit weird and if you don’t want scroll bars then add a scrolling="no" attribute to the iframe. In Firefox the bars disappear when not being used anyway.

A solution for using this approach with the Android app is outlined by @Dries below.

6 Likes

OK, so with wget, I could not receive the file. Not on the same machine as oh, and not from any other machines either. (I get 404). Does this mean that authentication is anyway on?

Thanks! This works for me as well. And it is really fast. But it does not work when using the reverse proxy, but maybe this is just a missing set-up somewhere(?).

Will test more this week-end. :slight_smile:

I’m trying to get this setup on my OH 1.8 installation. I believe I’ve completed the install and configuration of InfluxDB as I can see the graph the Sine Wave script creates.

Any points of where I should look? Where’s the gotcha’s I need to look out for? As I’m at work at the moment I cant provide my config files, but can do so later on.

Thanks,

Garry

You need to provide a lot more detail about what you have done and what exactly isn’t working. You say you see the graph so presumably you have Grafana working. Are your charts not appearing on your sitemap? Are your Items you expect to see charted not showing up?

Trying to install InfluxDB on a Raspberry2. According to InfluxDB Docs Page it should be done by:

sudo apt-get install influxd

However runnig that command I only get

sudo apt-get install influxdb
Reading package lists… Done
Building dependency tree
Reading state information… Done
E: Unable to locate package influxdb

Am I missing something?

Installation on the Raspberry Pi is not as easy as on a normal x86 system as it’s based on an ARM architecture. However, here are the steps you have to follow: https://github.com/ThomDietrich/openhabian/blob/master/openhabian-setup.sh#L542-L563 (just ignore cond_redirect)

wget -O /tmp/download.tar.gz https://dl.influxdata.com/influxdb/releases/influxdb-1.0.0_linux_armhf.tar.gz
tar xvzf /tmp/download.tar.gz -C / --strip 2
cp /usr/lib/influxdb/scripts/influxdb.service /lib/systemd/system/influxdb.service
adduser --system --no-create-home --group --disabled-login influxdb
chown -R influxdb:influxdb /var/lib/influxdb
systemctl daemon-reload
systemctl enable influxdb.service
systemctl start influxdb.service
1 Like

Worked like a charm (adding sudo;-) )
Thanks!

1 Like

I just spent two hours on installing influxdb via apt-get on a Raspbery Pi 3 and got it working finally:

First thing you have to do is
sudo apt-get install apt-transport-https
because the repository is fetched via https and not http
More info: "method driver /usr/lib/apt/methods/https could not be found" update error - Ask Ubuntu

Then do an sudo apt-get update

For Raspbian Jessie:

curl -sL https://repos.influxdata.com/influxdb.key | sudo apt-key add -
source /etc/os-release
test $VERSION_ID = "8" && echo "deb https://repos.influxdata.com/debian jessie stable" | sudo tee /etc/apt/sources.list.d/influxdb.list

More info: https://docs.influxdata.com/influxdb/v1/introduction/get-started/ (look for debian instructions)

sudo apt-get update && sudo apt-get install influxdb

Everything else (setup, config, getting started) works like the instructions in the first post (thanks @ThomDietrich)

Have fun.

3 Likes

I think those two posts should be referenced for other that are trying to install influxDB on a raspberry.
Due to the never ending effort of @rlkoshak to suggest this change, there will be coming more!

The influxDB is running now. however the Retention Policy doesn’t do, what it is expected to do.
I’ve create a Retention Policy for 1h, after I hsad stored values for an hour, no more values where persisted. So it kept the old values instead of persisting new ones and dropping older ones. Checked that using the REST API and direct on the DB with the CLI.

My other problem is installing Grafana.on my Raspberry
I tried to follow the path as decribed by @ThomDietrich for InfluxDB, i.e. using his openhabian code-lines. However that didn’t work for this line:

sudo apt -y install grafana || FAILED=2

I got the some error as with InfluxDB reported above

E: Unable to locate package grafana

Alternative: GitHub - fg2it/grafana-on-raspberry: Grafana packages for raspberry pi (armv6/armv7) and aarch64/arm64

Data from OpenHAB isn’t populating the InfluxDB. Here’s a the config details;

# The name of the default persistence service to use
persistence:default=influxdb

############################ InfluxDB Persistence Service #############################
#
# The database URL, e.g. http://127.0.0.1:8086 or https://127.0.0.1:8084 .
# Defaults to: http://127.0.0.1:8086
influxdb:url=http://192.168.10.6:8086

# The name of the database user, e.g. openhab.
# Defaults to: openhab
influxdb:user=openhab

# The password of the database user.
influxdb:password=MYPASSWORD

# The name of the database, e.g. openhab.
# Defaults to: openhab
influxdb:db=openhab_db

The data in the database is from the Sine Wave script. So I’m guessing I’ve got a config item wrong.

Here’s my persist details;

Strategies {
everyHour : “0 0 * * * ?”
}

Items {
HRT4_ZW_Temperature* : strategy = everyChange, everyHour
Weather_Temperature, SpeedtestResultDown : strategy = everyChange
}

Ah nice! I had no idea the arm binaries are now also available in the repository (were not before). Thanks for pointing that out! :wink: (@KjetilA: this may be interesting to you too)

As said a couple of times in this thread: Do not waste your time with retention policies. Even with a big openHAB setup the stored data will sum up to a few Megabytes per year…

That’s actually what is used in the openHABian steps. @opus obviously something went wrong while you worked through the steps. Can you check every step again?

The linked openHABian lines are by the way not yet part of the menu as I am still in he process of finishing them.

Your setup looks good. Please check your openhab.log and the log by influxdb for more details.