Hi,
While monitoring my openHAB instance, I can see that the CPU load while OH is running normally repeatedly during some minutes hits 20-30%. But settles out at an average of 4-5%. I suspect the 20-30% CPU load to be something that should be optimized. Appreciate if someone is able to help me to narrow this down.
- Platform information:
- Hardware: i7-2620M CPU, x64, 16GB RAM, 1000GB SSD
- OS: Windows 10, 1903
- Java Runtime Environment: Zulu 8.42.0.23(x64), JDK 8.0.232
- openHAB version: OH 2.5 M5
- Issue of the topic: Find CPU intensive part
- Please post configurations (if applicable):
- Items configuration related to the issue - dont know yet
- Sitemap configuration related to the issue - dont know yet
- Rules code related to the issue -dont know yet
- Services configuration related to the issue - dont know yet
- If logs where generated please post these here using code fences: In Karaf console using
Threads --listreveals this thread as the problem: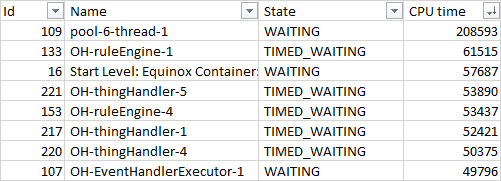

Running Threads 109 repeatedly gives me:
Thread 109 pool-6-thread-1 WAITING
until this shows up:
Thread 109 pool-6-thread-1 RUNNABLE Stacktrace: org.glassfish.jersey.servlet.internal.ResponseWriter$NonCloseableOutputStreamWrapper.write line: 315 org.glassfish.jersey.message.internal.CommittingOutputStream.write line: 244 org.glassfish.jersey.message.internal.WriterInterceptorExecutor$UnCloseableOutputStream.write line: 289 org.glassfish.jersey.media.sse.OutboundEventWriter$1.write line: 152 java.io.OutputStream.write line: 116 java.io.OutputStream.write line: 75 org.eclipse.smarthome.io.rest.core.internal.GsonProvider.writeTo line: 71 org.glassfish.jersey.media.sse.OutboundEventWriter.writeTo line: 135 org.glassfish.jersey.media.sse.OutboundEventWriter.writeTo line: 65 org.glassfish.jersey.message.internal.WriterInterceptorExecutor$TerminalWriterInterceptor.invokeWriteTo line: 265 org.glassfish.jersey.message.internal.WriterInterceptorExecutor$TerminalWriterInterceptor.aroundWriteTo line: 250 org.glassfish.jersey.message.internal.WriterInterceptorExecutor.proceed line: 162 org.glassfish.jersey.message.internal.MessageBodyFactory.writeTo line: 1130 org.glassfish.jersey.server.ChunkedOutput$1.call line: 219 org.glassfish.jersey.server.ChunkedOutput$1.call line: 190 org.glassfish.jersey.internal.Errors.process line: 315 org.glassfish.jersey.internal.Errors.process line: 242 org.glassfish.jersey.process.internal.RequestScope.runInScope line: 367 org.glassfish.jersey.server.ChunkedOutput.flushQueue line: 190 org.glassfish.jersey.server.ChunkedOutput.write line: 180 org.eclipse.smarthome.io.rest.sse.internal.SseEventOutput.write line: 46 org.eclipse.smarthome.io.rest.sse.internal.SseEventOutput.write line: 1 org.glassfish.jersey.server.Broadcaster$1.run line: 154 org.glassfish.jersey.server.Broadcaster$1.run line: 151 org.glassfish.jersey.server.Broadcaster.forEachOutput line: 204 org.glassfish.jersey.server.Broadcaster.broadcast line: 151 org.eclipse.smarthome.io.rest.sse.SseResource$1.run line: 131 java.util.concurrent.ThreadPoolExecutor.runWorker line: 1149 java.util.concurrent.ThreadPoolExecutor$Worker.run line: 624 java.lang.Thread.run line: 748
and this one:
Thread 109 pool-6-thread-1 RUNNABLE Stacktrace: java.lang.StringCoding.encode line: 350 java.lang.String.getBytes line: 941 org.eclipse.smarthome.io.rest.core.internal.GsonProvider.writeTo line: 71 org.glassfish.jersey.media.sse.OutboundEventWriter.writeTo line: 135 org.glassfish.jersey.media.sse.OutboundEventWriter.writeTo line: 65 org.glassfish.jersey.message.internal.WriterInterceptorExecutor$TerminalWriterInterceptor.invokeWriteTo line: 265 org.glassfish.jersey.message.internal.WriterInterceptorExecutor$TerminalWriterInterceptor.aroundWriteTo line: 250 org.glassfish.jersey.message.internal.WriterInterceptorExecutor.proceed line: 162 org.glassfish.jersey.message.internal.MessageBodyFactory.writeTo line: 1130 org.glassfish.jersey.server.ChunkedOutput$1.call line: 219 org.glassfish.jersey.server.ChunkedOutput$1.call line: 190 org.glassfish.jersey.internal.Errors.process line: 315 org.glassfish.jersey.internal.Errors.process line: 242 org.glassfish.jersey.process.internal.RequestScope.runInScope line: 367 org.glassfish.jersey.server.ChunkedOutput.flushQueue line: 190 org.glassfish.jersey.server.ChunkedOutput.write line: 180 org.eclipse.smarthome.io.rest.sse.internal.SseEventOutput.write line: 46 org.eclipse.smarthome.io.rest.sse.internal.SseEventOutput.write line: 1 org.glassfish.jersey.server.Broadcaster$1.run line: 154 org.glassfish.jersey.server.Broadcaster$1.run line: 151 org.glassfish.jersey.server.Broadcaster.forEachOutput line: 204 org.glassfish.jersey.server.Broadcaster.broadcast line: 151 org.eclipse.smarthome.io.rest.sse.SseResource$1.run line: 131 java.util.concurrent.ThreadPoolExecutor.runWorker line: 1149 java.util.concurrent.ThreadPoolExecutor$Worker.run line: 624 java.lang.Thread.run line: 748
I have the following bindings installed, and they seems to be working fine:
- Astro
- Exec
- HTTP
- hue
- IpCamera
- LogReader
- MQTT
- Netatmo
- Network
- Sonos
- Systeminfo
- TRÅDFRI
- Z-Wave


