Best approach for energy consumption usage - Queries?

Hi,

I’m trying to figure out the best approach for storing and accessing historic energy consumption. My goal is to try to eliminate the need for Grafana and use the OH main UI widgets/Analyze items to get the insights I want but the more I investigate my options, the more I’m bouncing against limitations in OH.

I have a DSMR, this is a serial data logger which currently logs all energy usage (kwh) into different items. I have Gas and Electricity which is dividend into 4 separate values:

  • Consumption - Peek
  • Consumption - OffPeek
  • Producing - Peek
  • Producing - OffPeek

And I have a selection of Shelly PM devices gathering current power usage (w) of high consuming devices.

Currently my persistence persists the states every minute.

With Grafana you use queries to fetch and process the persisted data to your liking. And here’s where the first hurdle is within OH, you cant use queries. Nor the REST API, Persistence services and Custom widgets cant use them. in fact, the Label custom widget can only get the current state of an item, not a historical one.

Trying to get around this short come I build a iframe custom widget with a JS backed script which pulls data from the REST API persistence and does some basic calculation. This actually works very well for the DSMR energy usage, as I can pull the first record of this month and the current one and calculate the difference and voila. I can show this number in the iframe widget and takes just 2 calls to the REST API. But for the shelly’s, where I persists the current power usage (and not the hourly consumption) I need to pull all the persisted data and process it and calculate the usage. It works when calculating this for a few days, but when pulling weeks/months of data, it’s just to slow and you pull a lot of MB’s from the REST API. So this approach works for the DSMR, but just for calculating a number, and not for graphing.

To get around this problem I created separate items for day/week/month/year. Then I created Stored Procedures which processes the existing persisted data and fills those tables. I could use rules for this and build the historic data once with some queries, but just to prove the concept I created SP’s. I now have separate items which I can use in widgets and Analyze items. But for the DSMR I would like to do some calculations between the energy usage vs production to get the actual usage. This is currently not possible in Analyze items.

It just feels cumbersome as the data is already persisted in the single items, if OH would support queries at some areas it would make it so much more powerful and yet simplistic.

I’m very interested in how others handle this? Do you have any examples/rules/item structure to get your power usage insights?

And is queries something that will come to OH?

Thanks,
Bastiaan

I’m trying the same since some time and I’m also running into limitations using the Main UI. My biggest issue at the moment is, that visualisation greater one year is no possible with the charts. I opened an issue for this some time ago:

Yes, it would be good if we could use SQL queries inside rules for the persistence service. Maybe you could write an issue for this. I think this would be a very helpful improvement.

Not sure what you exactly mean, but with .historicState(ZonedDateTime) you could get the historical one. Be careful it searches the next value in the past, but not into the future beginning from the given “ZonedDateTime” parameter.

What is this?

I would create a virtual counter, which is increased by a rule. Then you don’t need to sum up single consumption values.

I have done the same. Actual values are calculated for every new reading, historical ones only at midnight.

Would that help a bit?

This change would be trivial to provide.

1 Like

Actually we need it also here :slight_smile: Can you also take a look at it, if you could add it :slight_smile:

This is the description, how to add the chart pages:

A good half of the persistence add-ons do not “speak” SQL. If an issue is created I’d word it more generically.

Go to Developer Tools → API Explorer and review the persistence end points.

The REST API is how all the UIs interact with the server.

You know this idiom “with the one finger and the whole hand” ? :wink:

Already looking into that as well but this is MUCH more complicated. So, in case I won’t find any easy solution would you be happy to at least get what I already posted?

And: never ever complain if the chart loading time would become to slow, will you?!

1 Like

And this is exactly why I doubt that this can be implemented in a generic way.
… but let’s wait to the answer of that to be created issue.

Yes I know, but you give some hope! :slight_smile: But your change is already a step forward. Thanks!

Actually you only need the first and last of each months.

But performance of the persistence service is already a big issue for me. I have my data in JDBC/MySQL. The MySQL database is in the cloud. Even with very less values (<200) data the loading time of the chart was very slow. Now I have 7000 values in the database and I need to wait about 15s until I see the chart.
The persistence service seems to always get the complete data indepentent if you use Diff_last, Diff_first, Sum…

This my current log:

2023-11-21 06:27:08.212 [DEBUG] [jdbc.internal.JdbcPersistenceService] - JDBC::query: item is StromHaus_Zaehlerstand
2023-11-21 06:27:08.214 [DEBUG] [persistence.jdbc.internal.JdbcMapper] - JDBC::getHistItemFilterQuery filter='true' numberDecimalcount='3' table='item0001' item='StromHaus_Zaehlerstand (Type=NumberItem, State=34584.0945, Label=Strom Haus Zählerstand, Category=energy, Tags=[Energy, Point], Groups=[gPersistenceMysql, gStromZaehlerstand, Zaehler])' itemName='StromHaus_Zaehlerstand'
2023-11-21 06:27:08.217 [DEBUG] [istence.jdbc.internal.db.JdbcBaseDAO] - JDBC::getHistItemFilterQueryProvider filter = FilterCriteria [itemName=StromHaus_Zaehlerstand, beginDate=2022-12-31T23:00Z, endDate=2023-12-31T22:59:59.999Z, pageNumber=0, pageSize=2147483647, operator=EQ, ordering=ASCENDING, state=null], numberDecimalcount = 3, table = item0001, simpleName = StromHaus_Zaehlerstand
2023-11-21 06:27:08.220 [DEBUG] [istence.jdbc.internal.db.JdbcBaseDAO] - JDBC::query queryString = SELECT time, value FROM item0001 WHERE TIME>='2023-01-01 00:00:00' AND TIME<='2023-12-31 23:59:59' ORDER BY time ASC
2023-11-21 06:27:08.222 [DEBUG] [istence.jdbc.internal.db.JdbcBaseDAO] - JDBC::doGetHistItemFilterQuery sql=SELECT time, value FROM item0001 WHERE TIME>='2023-01-01 00:00:00' AND TIME<='2023-12-31 23:59:59' ORDER BY time ASC
2023-11-21 06:27:09.088 [DEBUG] [istence.jdbc.internal.db.JdbcBaseDAO] - JDBC::ItemResultHandler::handleResult getState value = '30472.6623', unit = 'null', getClass = 'class java.lang.Double', clazz = 'Double'
2023-11-21 06:27:09.090 [DEBUG] [istence.jdbc.internal.db.JdbcBaseDAO] - JDBC::ItemResultHandler::handleResult getState value = '30472.7166', unit = 'null', getClass = 'class java.lang.Double', clazz = 'Double'
2023-11-21 06:27:09.092 [DEBUG] [istence.jdbc.internal.db.JdbcBaseDAO] - JDBC::ItemResultHandler::handleResult getState value = '30472.7378', unit = 'null', getClass = 'class java.lang.Double', clazz = 'Double'
2023-11-21 06:27:09.093 [DEBUG] [istence.jdbc.internal.db.JdbcBaseDAO] - JDBC::ItemResultHandler::handleResult getState value = '30472.783600000002', unit = 'null', getClass = 'class java.lang.Double', clazz = 'Double'
2023-11-21 06:27:09.095 [DEBUG] [istence.jdbc.internal.db.JdbcBaseDAO] - JDBC::ItemResultHandler::handleResult getState value = '30472.835400000004', unit = 'null', getClass = 'class java.lang.Double', clazz = 'Double'
2023-11-21 06:27:09.096 [DEBUG] [istence.jdbc.internal.db.JdbcBaseDAO] - JDBC::ItemResultHandler::handleResult getState value = '30472.944900000002', unit = 'null', getClass = 'class java.lang.Double', clazz = 'Double'
2023-11-21 06:27:09.098 [DEBUG] [istence.jdbc.internal.db.JdbcBaseDAO] - JDBC::ItemResultHandler::handleResult getState value = '30473.0921', unit = 'null', getClass = 'class java.lang.Double', clazz = 'Double'
....
....
2023-11-21 06:27:09.180 [DEBUG] [istence.jdbc.internal.db.JdbcBaseDAO] - JDBC::ItemResultHandler::handleResul2023-11-21 06:27:20.579 [DEBUG] [jdbc.internal.JdbcPersistenceService] - JDBC: Query for item 'StromHaus_Zaehlerstand' returned 6994 rows in 12365 ms

→ 6994 values in 12,3s; this is just too slow. These are houerly energy readings.

Let’s say you write the reading every minute, this would be more than 525000 values in one year; I think Openhab and JDBC can not handle this.

Reading all data makes no sense, if you want to have charts. What ideas do you have, as I might write an issue to improve it?

@rlkoshak Do you know the developer who might have further details, how this could be made faster?

If I were you, I would start to find the root cause and not blaming openHAB and JDBC straight away.
You have several possible bottlenecks, cloud, JDBC server config, openHAB server hardware and config….

1 Like

There isn’t one developer. Generic parts of Persistence shared by all are maintained by core. Different developers maintain the different Persistence add-ons.

I second @hmerk’s advice to start experimenting to determine exactly where your bottlenecks are because you have a lot of candidates.

Finally I’ll mention that while improving OH’s persistence is desirable and appreciated, it’s never going to be as good as a special purpose data analysis tool (e.g. Grafana). It’s always going to have an extra normalization layer between the database and the rest of OH and that layer is going to only be able to implement the least common denominator among all the persistence add-ons. Like I said above, there are nearly as many databases that do not speak SQL as there are that do.

1 Like

And I second the fact that if you want to go heavily into charts, go for grafana. It is definitely a steeper learning curve than just using a chart in openHAB but it is made for these things and finally worth doing it.

Grafana is in my opinion a little bit too much. The OH charts are fully sufficient, but the issue is how OH handles data. Even for a decade chart you only need 11 values from the database; all energy readings on January 1st for the last ten years, but not the whole database of the last ten years.
But OH is a framework and is not designed for doing energy visualisation what we need here. Maybe this has to be accepted and the future brings some improvements, but at the moment it is like it is.

Well, it seems like I’ve stirred up a bit of a community awakening.

My goal is to get basic insights, not in depth because then you obviously need a dedicated BI tool for that. To get some historic data from my energy meter is what I consider as basic and should not require a BI tool.

I have created the enhancement issue here.

Looking forward to everyone’s input on that.

Why don’t you then schedule a rule on every Jan 1st and post value that to a special “shadow” item and persist only that item value once at that day? Then you would only have on persisted value per year and you have only 10 in 10 years which will result in a lightning fast chart. You can create such a shadow item for each energy item. If you use a clever naming like shadow_myitem for myitem you could even do this for several items via a loop in a rule.

1 Like

A while ago I have implemented some form of such thing for OH 3.0 based on database scanner (sequential process in fact) which been going over items, their historic states within adjustable time slots (default and per item). With an extra “processor” which works on sequenced values - various aspects could be calculated. I’ve implemented energy calculation, proportions (two or more items) and COP (electricity vs heat). The proportion can be useful to i.e. observe % of energy provided by PV within a day or month. It is a derivative of two energy counters. Later I’ve added “realtime” aspect which worked with power and not just energy.

I’ve spent several weeks working on this first time and made it all java working without dsl/js etc… My first attempt assumed item names. It didn’t scale. Then I started sticking with item metadata and periodic execution of custom java rule (norule). Then I’ve done some sort of optimization over time to calculate only most recent slot (this year … up to this minute :wink: ) to save resources. Full recalculation is made only during first start or after refreshing of timer. Another optimization I’ve done is saving result at very end of slot (last millisecond of slot), so there is always single value for slot and database is tightened. Overall it took me approximately 3 months of continuous work.

A starting point for final version was “virtual item provider” which created items completely dynamically (no files, no jsondb entries), based on “root” item metadata. This way I was able to streamline operations in multiple installations, which essentially resulted in “zero adjustments” beyond core item definitions. Chart items with needed granularity come out of declared time slots.

Would I do it second time? Not sure - batch process was great for performance calculations (proportions and COP), yet making database querying a bit more dynamic would greatly simplify batch process. I’ve found several edge cases (ie. missing slots, jdbc and “edge” queries). Some of my own implementation bugs I been hunting for days to identify root cause and fix it. I had to bypass persistence manager in order to have complete control over “write time” for each and every calculated item state.

Did it scale? It did, it works with 2 GB of memory, without influxdb and grafana. Thing to remember - while there is just 1 slot for yearly, 12 for monthly and 365 for daily results there are 8760 hourly results, 35040 quarters there will be 525600 entries for minute statistics. You can draw 1440 datapoints on chart easily. If you take into account proportions - there will be additional item for each proportion member in each slot with corresponding data. Because all this happens per item, even 10 meters with minute resolution will generate a lot of data. Combined minutely chart will render quite slow, simply due to amount of data which needs to be pulled (1440 data points per each item). Don’t ask how I learned this.

Example chart (which you for sure you know from OH setups you have):

The “root” item with total energy reading, with utilization group used for dynamic items which come from “utilization” metadata.

Service configuration / metadata description.

I’ve described some of implementation aspects in Data compression - Ideas and concepts - Thing4, so anyone interested in “how” part is welcome to look and repeat it. :wink:
Hope that these will be valuable pointers for people interested in this topic.

1 Like

Thanks for your valuable feedback. A “virtual item provider” would be a big step forward. So you could use this one have one for yearly, hourly, weekly, monthly charts showing them with a good performance.

Is the “virtual item provider” then a thing with a couple channels like yearly, hourly, weekly, monthly data?

Also caching would be an improvement. You could keep a lot of data in the RAM, and old data which hasn’t change doesn’t need to be gathered again for the “virtual item provider”.

My decision was to only make one entry per hour. That means I always have only 8760 hourly results per year. This brings me already into performance issue. OH always takes all data once it’s needed, instead of doing a recalculation once new data is available and caching it somewhere.

It’s a very complex topic and I need to think about all this information. Is there a prototype for this virtual item provider available?

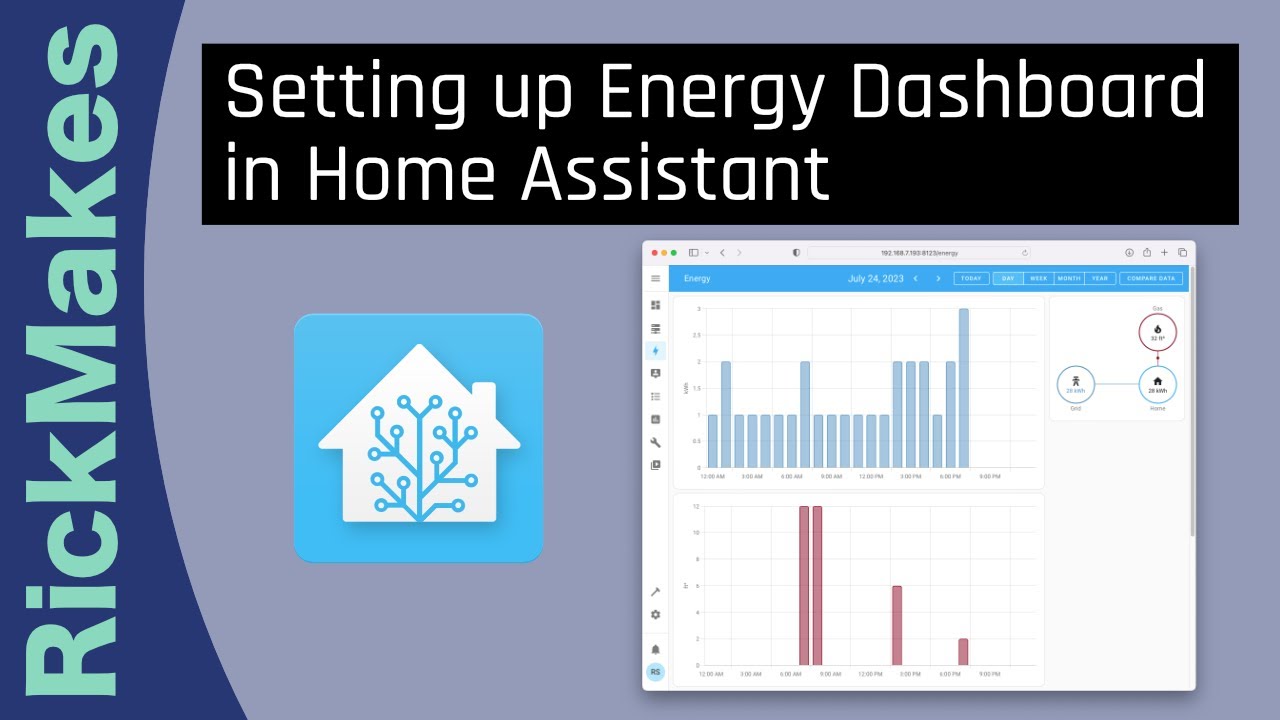
But anyway. I don’t like to point out to Home Assistant, but they have something like a energy wizard. It automatically creates all charts and especially it completely takes care of all energy data. In Openhab it takes you several months to visualize energy if you have no experience in Openhab, in Home Assistant you reach the same goal with better results in a couple minutes. In my opinion we really should think about how to improve the situation in Openhab or to accept the decision of the Openhab community to keep Openhab like it is.

openHAB is a community project. As nobody contributed something like this, feel free to do so.

To be fair Hans-Jörg I often thought about that but the way that openHAB stores data with the lack of item-Arrays or something similar I stopped looking into that.

The discussion here shows how difficult it is to integrate (sum up) energy the right way and then store it in away that can be nicely retrieved and displayed. I would love to make that super simple for any user. I know that Markus has a put a lot of thought into that on top of openHAB (though I have never seen that) and AFAIK sells this as a commercial service. And as you can see also @splatch has invested a lot of time into it.

I totally agree that something like this strikes me to be something that I envy HA for. I’d be the first to jump in to work on that if someone has a good idea how we could provide a backend that would do the persistence. I would love to tell openHAB to create an Energy / Power item and then have the possibility that openHAB automatically does the aggregation of hourly, daily, weekly, monthly, yearly… without having to create lots of items (to me that feels like a lot of boilerplate just for one measure point) and writing individual rules for that as I think it is actually a very valid usecase today. Plus of course provide the visualization…

However I think that the item approach nor the persistence approach we have in Core is very suitable for that. Maybe someone can come up with a clever idea. Btw, would an addon the right thing to do that energy intergration part or would that have to become part of a core functionality?

I don’t disagree Stefan. But as long as nobody comes up with a clever idea which can be discussed and nobody jumps in to implement it, it will always stay as it is.
If somebody is volunteering, hiho, please start doing it. I have nothing against it.

What I just do not like is such a comparison with other systems like HA.
They really benefit from paid developers who can be told to implement something the community demands. We do not have those and will never.

I remember long time ago there was a request for a feature and the user offered to pay for that, as there was no volunteer…

Yes, that was entire goal of it - having items which do not need to be managed other than by metadata. They are used primarily for charting.
The virtual item provider produce a items according to scheme $equipment_Utilization_$period, where $period is one of:

  • Yearly
  • Monthly
  • Weekly
  • Daily
  • Hourly
  • HalfHourly
  • QuarterHourly
  • Minutely
  • Secondly

I think above names are hurting native speakers - sorry, the consistency of *ly required that. :wink:
Other aspect to it - some meters can give you some of above dimensions (i.e. some WM-Bus meters report last N days, last 12-24 months and last years) - integration of such equipment would effectively break entire thing. It works with assumption that these items are feed by batch process. I think the timeseries stuff which comes in 4.1 will also make its own “repercussions” to what I did. :wink:

Caching and keeping the “warm” data for quick access is goal of database engines. I haven’t made any optimizations there, however you’re right - having a counter recorded in memory would get calculations much faster. I haven’t thought of that simply because entire thing had to fit into 32 bit arm v7 with 2 GB of memory. With Raspberry 5 and 8 GB of memory you could actually retain large chunk of data in memory.

That’s true - this was one of reasons why a while ago we brought a concept of “click” action for charts, so you could quickly narrow them from year down to day. Difficulty here is - OH charts are part of generic “action” supported by other so you miss a “context” once a bar on chart is clicked. When you are on May, you wish to see May’s daily consumption and not Novembers (or what ever other month you are at).

I don’t think there is any ATM. I did it as part of experiments for our implementation, however I didn’t promote it any further, simply because its use was quite specific to projects we got. Maybe some day I will find time to describe how to do it.

Reality is - that there is still a long lap of making it easy for end user. With all stuff mentioned above - I was in most of cases responsible for making deployment. Technicians who worked on the field, people whom I’d consider close to end user, didn’t touch the system. Which turns to be a big failure - it meant, that even with above adjustments, it was not easy enough.