JSR223 scripts get wrapped in a safeCall, as well as rule executions. I would guess that your “bad” rule caused many many calls to be sent through the safeCall queue, greatly increasing the probability of hitting the race condition in LinkedTransferQueue. Good to know though that if you’re hitting this quite often, it might be because something in your setup is causing it to get triggered more often.
Thanks for reading Cody. For the record, this is a rule that runs every 30 seconds for most the day (from sunrise to sunset) So it executes a lot. But to be fair, the DSL version ran for over two years before I converted the rule to jRuby. The jRuby version was fine until the switch to OH4 and the new jRuby library which is where the error came from. I been meaning to start another thread to ask for help on that.
I have rules that executes a lot more often than every 30 seconds. The frequency shouldn’t be the issue.
It sounds like you might need to open a new topic and paste the rule so we can take a look in case it’s something that can be mitigated in the helper library or core.
Do you still experience that issue today?
Florian, are you asking me? If so, yes, I’m still experiencing this issue. (most recently yesterday morning) Running 4.0.0 snapshot 3460.
I am more or less asking anyone here, just interested what is the state here.
That is a really old snapshot, the last 4.0.0 SNAPSHOT was probably 355x, the latest SNAPSHOT is 3570.
I’m still experiencing the issue. I created a script from Cody’s post above and run it occasionaly when the problem occurs and it clears the issue
yeah, sorry, I disabled most my rules and sort of gave up. I figured because no one else was reporting that it was something unique to my set up and have been meaning to start fresh from a clean install but never got around to it.
I still see it occasionally. I’m running 4.0.0.M5 on my main instance (I have a handful of addons that I need to polish up PRs on, but in the meantime I rebase, recompile, and reinstall them each time I update openHAB, so it’s not something I do unless I have time to sit down for a bit and get it done).
This happens to me as well with latest 4.0 release build using ubuntu’s build of openjdk 17. The thread consuming all the resources seems to always be the “items-queue”.
Do you see any messages regarding large queue size in the log?
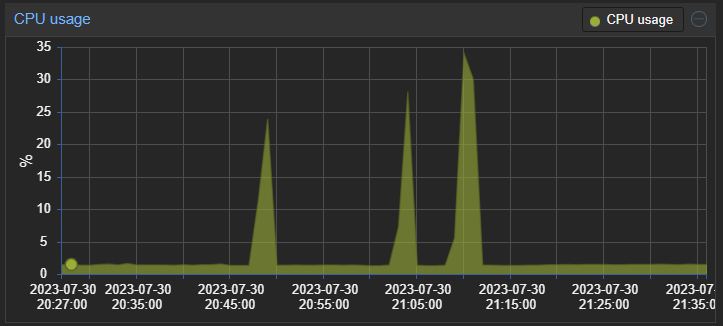
No messages regarding large queue size. CPU spikes roughly three times an hour with no specific frequency. I cannot seem to pair it to any events in event log or messages in openhab log. I only noticed the CPU spikes because the CPU fan revs up when it is under load.
I was thinking of switching to an Azul openjdk build, but I’m not thinking this will make much of a difference. I noticed the jdk bug referenced earlier (https://bugs.java.com/bugdatabase/view_bug?bug_id=8301341) has been recently fixed, but it is only on the openjdk 22 master branch right now.

Same issue with safeCall-queue using 100% on OH 4.0. Nothing in the logs.
This is on a RPI3 with:
openjdk version “17.0.7” 2023-04-18
OpenJDK Runtime Environment Temurin-17.0.7+7 (build 17.0.7+7)
OpenJDK Server VM Temurin-17.0.7+7 (build 17.0.7+7, mixed mode
My rules are all UI written in Groovy.
Are there moments you have massive updates of items? Does it correspond to the spikes?
What persistence services are you using?
At most I might have about 25 items all updating around the same time. I’m using RRD4j and MapDB persistence.
For me its not a spike, safeCall-queue looks to be constantly using 100% cpu for at least the last 3 hours.
I am not using MapDB, so maybe it’s worth testing without it.
If a thread is misbehaving, create a thread dump and see what the threads are doing by executing the threads command in the Console.
I ran jstack and it looks stuck the same as the OP
"safeCall-queue" #149807 prio=5 os_prio=0 cpu=11683997.90ms elapsed=11700.68s allocated=136B defined_classes=0 tid=0x4bf55f20 nid=0x5ee1 runnable  [0x5995e000]
   java.lang.Thread.State: RUNNABLE
        at java.util.concurrent.LinkedTransferQueue.awaitMatch(java.base@17.0.7/LinkedTransferQueue.java:652)
        at java.util.concurrent.LinkedTransferQueue.xfer(java.base@17.0.7/LinkedTransferQueue.java:616)
        at java.util.concurrent.LinkedTransferQueue.poll(java.base@17.0.7/LinkedTransferQueue.java:1294)
        at org.openhab.core.common.QueueingThreadPoolExecutor$1.run(QueueingThreadPoolExecutor.java:193)
        at java.lang.Thread.run(java.base@17.0.7/Thread.java:833)
The 100% CPU issue is when the underlying queue is empty for a thread. It fixes itself when enough items are sent through the higher level queue to necessitate sending one through the lower level queue.
I asked for a backport to Java 17 in the PR with the fix. ![]()