Hi community,
since I have now setup my openhab3 with all items etc. for a few month, I am working my way through persistence/tracking of my values (e.g. temperature). Having persistence working, I would like to create a few charts on my pages. But here I run into a - probably simple - issue:
If I use my carbon dioxide values, it gets displayed in a decimal figure, which is hard to track on a chart. However, if I check the item, it is already a ppm value at around 1.000.
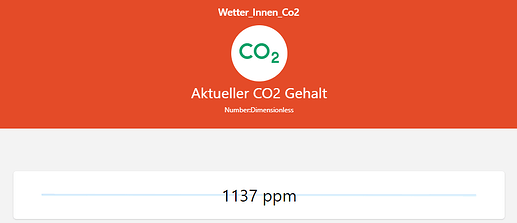
Please find a screenshot of the chart as well as the item:
How can I make the values of the CO2 display in thousands ppm?

