Normally it’s not needed but if you change a lot of things around openHAB get’s confused 
Besides you should look into a hierarchy for your groups. Check out my configuration for some ideas.
My guess is, that this cron timer runs every second every other 15 minutes. Shouldn’t the expression be “0 */15 * * * ?” ?
Yes, it should have been 0 */15 but I dont use it yet so I didnt even notice, it was just there for future ideas, but I got it corrected now 
But the way I read it the only way to get access is to render images which takes quite long on the hardware that I am using.
I just thought that there must be a way to make myopenhab do the proxying. That would enable ssl encryption, logon and all the benefits of that system without requiring static IP address or 3rd party services
But if that is not possible then it is not possible
Hi, thanks for pointing out there are .debs also. I didn’t find them in the first place as they are not listed on influxdb downloads pages. I thought I share my “ansibled” version of the above for those who use it. I control my boxes with ansible, so here is my 2 cents:
It also mounts NFS store point for measurements on given NAS.
1 Like
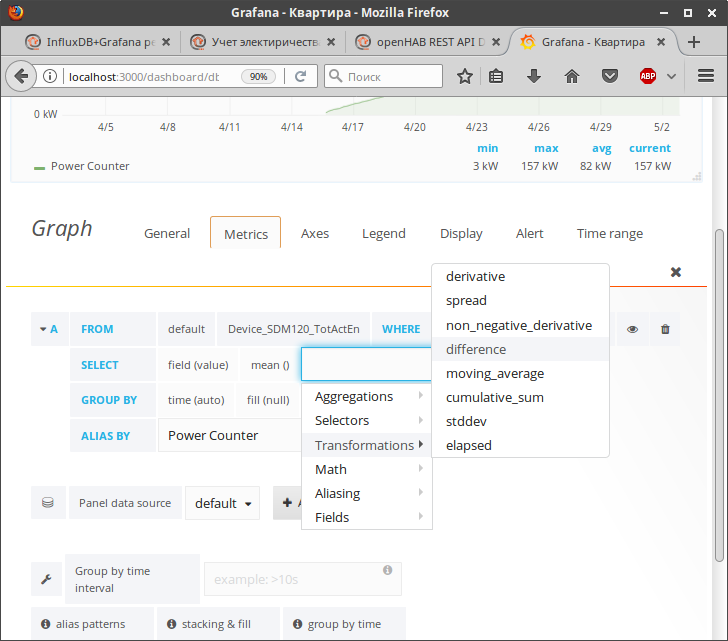
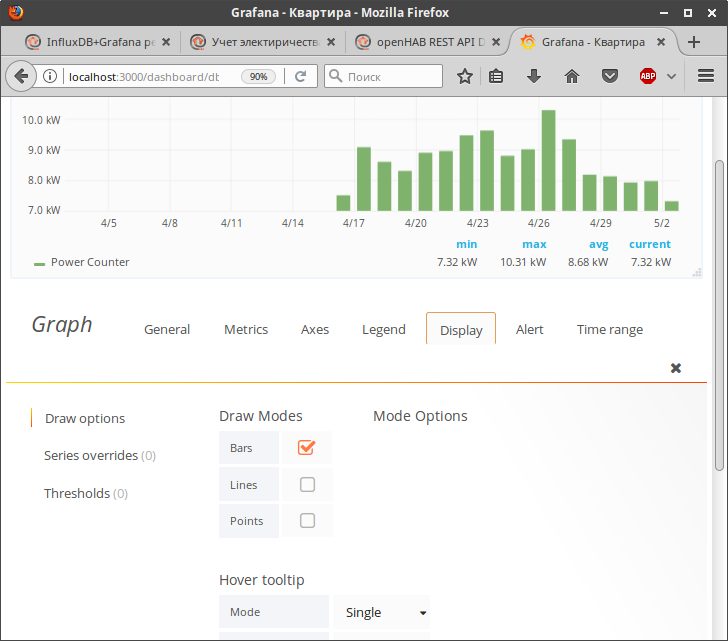
How to do Daily graphs from one power counter Item using Grafana.
-
Here simple Power counter graph:
-
Add
Trasformation - differencefield:
-
Change
GROUP BYtotime(1d)
-
Change draw mode to
Bars:


6 Likes
[/quote]
[/quote]
[/quote]
[quote=“bongtron, post:314, topic:13761, full:true”]
hi,
thank you for such a detailed tutorial.Can you please help

I am unable to get openhab to write to the  influx db write to the database
I get this  error through debug:
.
.
.
06:03:44.527 [ERROR] [i.i.InfluxDBPersistenceService:109  ] - influxdb:password
.6:03:44.538 [DEBUG] [.p.internal.PersistenceManager:146  ] - Initializing influxdb persistence service.
06:03:44.643 [DEBUG] [.p.internal.PersistenceManager:428  ] - Scheduled strategy influxdb.everyHour with cron expression 0 0 * * * ?
06:03:44.652 [DEBUG] [.p.internal.PersistenceManager:428  ] - Scheduled strategy influxdb.everyDay with cron expression 0 0 0 * * ?
06:03:44.661 [DEBUG] [.p.internal.PersistenceManager:428  ] - Scheduled strategy influxdb.everyMinute with cron expression 0 * * * * ?
.
.
.
.
.
I have changed the openhab.cfg file  but the same error is reprted

am running the following
raspberrry 2B
openhab 1.83
influxdb  version 1.2.2


using the persistence file : org.openhab.persistence.influxdb-1.8.3

the openhab.cfg files settings are :
[quote=“bongtron, post:314, topic:13761, full:true”]
hi,
thank you for such a detailed tutorial.Can you please help
I am unable to get openhab to write to the influx db write to the database
I get this error through debug:
.
.[quote=“bongtron, post:314, topic:13761, full:true”]
hi,
thank you for such a detailed tutorial.Can you please help
I am unable to get openhab to write to the influx db write to the database
I get this error through debug:
.
.```
.
[quote=“bongtron, post:314, topic:13761, full:true”]
hi,
thank you for such a detailed tutorial.Can you please help
I am unable to get openhab to write to the influx db write to the database
I get this error through debug:
.
.
.
06:03:44.527 [ERROR] [i.i.InfluxDBPersistenceService:109 ] - influxdb:password
.6:03:44.538 [DEBUG] [.p.internal.PersistenceManager:146 ] - Initializing influxdb persistence service.
06:03:44.643 [DEBUG] [.p.internal.PersistenceManager:428 ] - Scheduled strategy influxdb.everyHour with cron expression 0 0 * * * ?
06:03:44.652 [DEBUG] [.p.internal.PersistenceManager:428 ] - Scheduled strategy influxdb.everyDay with cron expression 0 0 0 * * ?
06:03:44.661 [DEBUG] [.p.internal.PersistenceManager:428 ] - Scheduled strategy influxdb.everyMinute with cron expression 0 * * * * ?
.
.
.
.
.
I have changed the openhab.cfg file but the same error is reprted
am running the following
raspberrry 2B
openhab 1.83
influxdb version 1.2.2
using the persistence file : org.openhab.persistence.influxdb-1.8.3
the openhab.cfg files settings are :
influxdb:url=http://localhost:8086
influxdb:user=openhab
The password of the database user.
influxdb:password=openhab
influxdb:db=openhab_db
influxdb:retentionPolicy=default
06:03:44.527 [ERROR] [i.i.InfluxDBPersistenceService:109 ] - influxdb:password
.
.
.
.
I have changed the openhab.cfg file  but the same error is reprted

am running the following
raspberrry 2B
openhab 1.83
influxdb  version 1.2.2


using the persistence file : org.openhab.persistence.influxdb-1.8.3

the openhab.cfg files settings are :


 influxdb:url=http://localhost:8086


 influxdb:user=openhab

# The password of the database user.
 influxdb:password=openhab
influxdb:db=openhab_db
influxdb:retentionPolicy=default


06:03:44.527 [ERROR] [i.i.InfluxDBPersistenceService:109  ] - influxdb:password


.
.
.
.
I have changed the openhab.cfg file  but the same error is reprted

am running the following
raspberrry 2B
openhab 1.83
influxdb  version 1.2.2


using the persistence file : org.openhab.persistence.influxdb-1.8.3

the openhab.cfg files settings are :
influxdb:url=http://localhost:8086
influxdb:user=openhab
The password of the database user.
 influxdb:password=openhab
influxdb:db=openhab_db
influxdb:retentionPolicy=default
the error
06:03:44.527 [ERROR] [i.i.InfluxDBPersistenceService:109 ] - influxdb:password
Try to troubleshoot the password. It seems that something is wrong with that. Did you enable correctly authentication in InfluxDB? (auth-enabled option to true in the [http] section of the /etc/influxdb/influxdb.conf configuration file)
Can you connect from your local host by:
influx -username openhab -password openhab
and test HTTP auth also:
curl -G http://localhost:8086/query -u openhab:openhab --data-urlencode "q=SHOW DATABASES"
If they don’t work, reset the password of the influxdb user openhab:
influx
SET PASSWORD FOR openhab = 'openhab'
change also influxdb:retentionPolicy=default to influxdb:retentionPolicy=autogen (since you use InfluxDB 1.2.2)
thank you I had a re look, but no luck yet! the
02:35:05.456 [ERROR] [i.i.InfluxDBPersistenceService:109 ] - influxdb:password
remains whether I use a different user or not ,
I tried the query as suggested ,it returns:
name: databases
name
----
_internal
openhab_db
the settings of the : /etc/influxdb/influxdb.conf configuration file)
[admin]
  # Determines whether the admin service is enabled.
   enabled = true

  # The default bind address used by the admin service.
   bind-address = ":8083"

  # Whether the admin service should use HTTPS.
  # https-enabled = false

  # The SSL certificate used when HTTPS is enabled.
  # https-certificate = "/etc/ssl/influxdb.pem"

###
### [http]
###
### Controls how the HTTP endpoints are configured. These are the pr$
### mechanism for getting data into and out of InfluxDB.
###

[http]
  # Determines whether HTTP endpoint is enabled.
   enabled = true

  # The bind address used by the HTTP service.
   bind-address = ":8086"

  # Determines whether HTTP authentication is enabled.
   auth-enabled = true

  # The default realm sent back when issuing a basic auth challenge.
  # realm = "InfluxDB"

  # Determines whether HTTP request logging is enable.d
  # log-enabled = true

openhab.cfg corrected file

influxdb:url=http://localhost:8086

# The name of the database user, e.g. openhab.
# Defaults to: openhab
 influxdb:user=openhab

# The password of the databasautoe user.
 influxdb:password=openhab

# The name of the database, e.g. openhab.
# Defaults to: openhab
 influxdb:db=openhab_db

#retention policy
influxdb:retentionPolicy=autogen
Please use code fences for code, as otherwise Discourse will interfere, as you can see…
You can use the buttons above text input field or just paste three backticks (`) before and after code:
```
code goes here
```
noted thank you, was wondering why mine looks different.
@bongtron have you found a solution ?
I have the same problem for over a month now, have been looking long time for wat is the problem see previous posts, but didn find any solution yet.
I think it has something to do with installation rights user rights to be able to access files ?
I did the installation with openhabian, and have allready had problems that users are configured with different access and had to chown the access of the openhab user ons serveral files to make it work.
Was a problem with "mcp23017 binding"
But have not found the problem with influx DB, and it exaclty the same as yours, also tried different users and, changed passwords, deinstalled and reinstalled influxdb, nothing helped so far.
the openab user is not able to ask for database, but I have uses admin accounts as wel
[05:45:53] openhabian@openHABianPi:~$ curl -G http://localhost:8086/query -u openhab:Open498#Hab@698Ian --data-urlencode "q=SHOW DATABASES"
{"error":"error authorizing query: openhab not authorized to execute statement 'SHOW DATABASES', requires admin privilege"}
hi Dan,
no luck yet on my site , I have applications running well on 1.83 its just that I wanted to try the nice look of the grafana graphical user interface. It’s been 5 days!I hope other users will be able to assist.
I am not sure if its a similar problem but I had the same problem.
make sure you first log in as an admin when using the console.
alternatively log in by using the influxdb web interface on another machine ,which I you van enable from the /influxdb.conf file and runs at port 8083 as indicate below.
[admin]
  # Determines whether the admin service is enabled.
   enabled = true

  # The default bind address used by the admin service.
   bind-address = ":8083"
then point your browser to:
http://yourpenhabhost:8083
I hope I understood you.
The Admin web page is a nice feature, It works well, but does not solve my problem for the openhab error
Today I installed a new influxDatabase on an ubuntu server. created everything like explained.
works well, also the sine.py test works with the openhab user.
But when I use openahab change the opnhabconfig to the new database
The same error
2017-05-07 11:44:18.793 [DEBUG] [org.openhab.persistence.influxdb    ] - ServiceEvent REGISTERED - {org.openhab.core.persistence.PersistenceService, org.openhab.core.persistence.QueryablePersistenceService}={url=http://192.168.1.58:8086, component.name=org.openhab.persistence.influxdb, IP=192.168.1.58, retentionPolicy=autogen, USER=openhab, DB=openhab_db, dbName=openhab_db, service.pid=org.openhab.influxdb, component.id=196, PASSWORD=openhab, service.id=340, service.bundleid=203, service.scope=bundle} - org.openhab.persistence.influxdb
2017-05-07 11:44:18.800 [DEBUG] [.internal.InfluxDBPersistenceService] - influxdb persistence service activated
2017-05-07 11:44:18.801 [ERROR] [.internal.InfluxDBPersistenceService] - influxdb:password
I had the same problem the admin was working and the sine.py python program
could write to the influxdabse but not through openhab. This occurred only
when running the opwnhab 1.83 and disappeared on openhab 2.0 .
which version of openhab are you running?
I am on openhab 2.0,
The second time I installed openhab with openhabian, first time influx worked, but another binding did not work so I reinstalled everything and now the other binding works but not influx and also not mcp23017.
Still a lot of bugs. Now I know that is not the installation of influx but problem / BUG with the binding.
There may be other ways to do attack this but posting here as ultimately I’d like to graph it in Grafana.
I’ve got an energy monitor that gives me real time energy usage (in Watts) every 10 seconds or so. I’m persisting this data in InfluxDB. What I’m hoping to do is somehow visual the total energy used (in Wh or kWH) over the day. I vaguely remember that I should be able to calculate this as “the area under the graph” - the integral I believe.
However I’m struggling to produce this view. Anyone able to assist?
Thanks
Hi guys,
I’m using InfluxDB and Grafana with good success. But I still have some open points regarding Grafana and how the data is persisted in measurements and finally shown in graphs.
My goal is to have a user friendly dashboard that provides as much information as possible. As Grafana provides functionality like Templating my thought was to use a variable with all the names of my homematic thermostats (i.e. Things) and let the user select either one or multiple of them. Then setup a graph that takes this variable and repeats itself with all of the selected names and displays the respective measurements (i.e. Items)
Before I continue let me give you some more details first. I have:
- homematic thermostats with 5 Items each that are autogenerated via PaperUI (e.g.
homematic_HMIP_eTRV_ccu_xxxxxxxxxxxxxx_0_RSSI_DEVICE, *1_ACTIVE_PROFILE, *1_BOOST_MODE, *1_SET_POINT_TEMPERATURE, *1_ACTUAL_TEMPERATURE) - one measurement for each of the items in InfluxDB with pairs of (time, value) data inside
I’ve managed to create a graph that collects data from multiple measuremets based on a variable $Serial like this:
SELECT mean("value") FROM /homematic_HMIP_eTRV_ccu_$Serial.*/ WHERE $timeFilter GROUP BY time($__interval) fill(null)
This graph repeats itself based on $Serial and has dynamic title as well. $Serial is a custom variable with all of the strings (e.g. xxxxxxxxxxxxxx, yyyyyyyyyyyyyy, zzzzzzzzzzzzzz, ...)
But, the result is not as user friendly as I thought. I like to replace the $Serial with something more human readable.
Any thoughts on that how it can be done?
