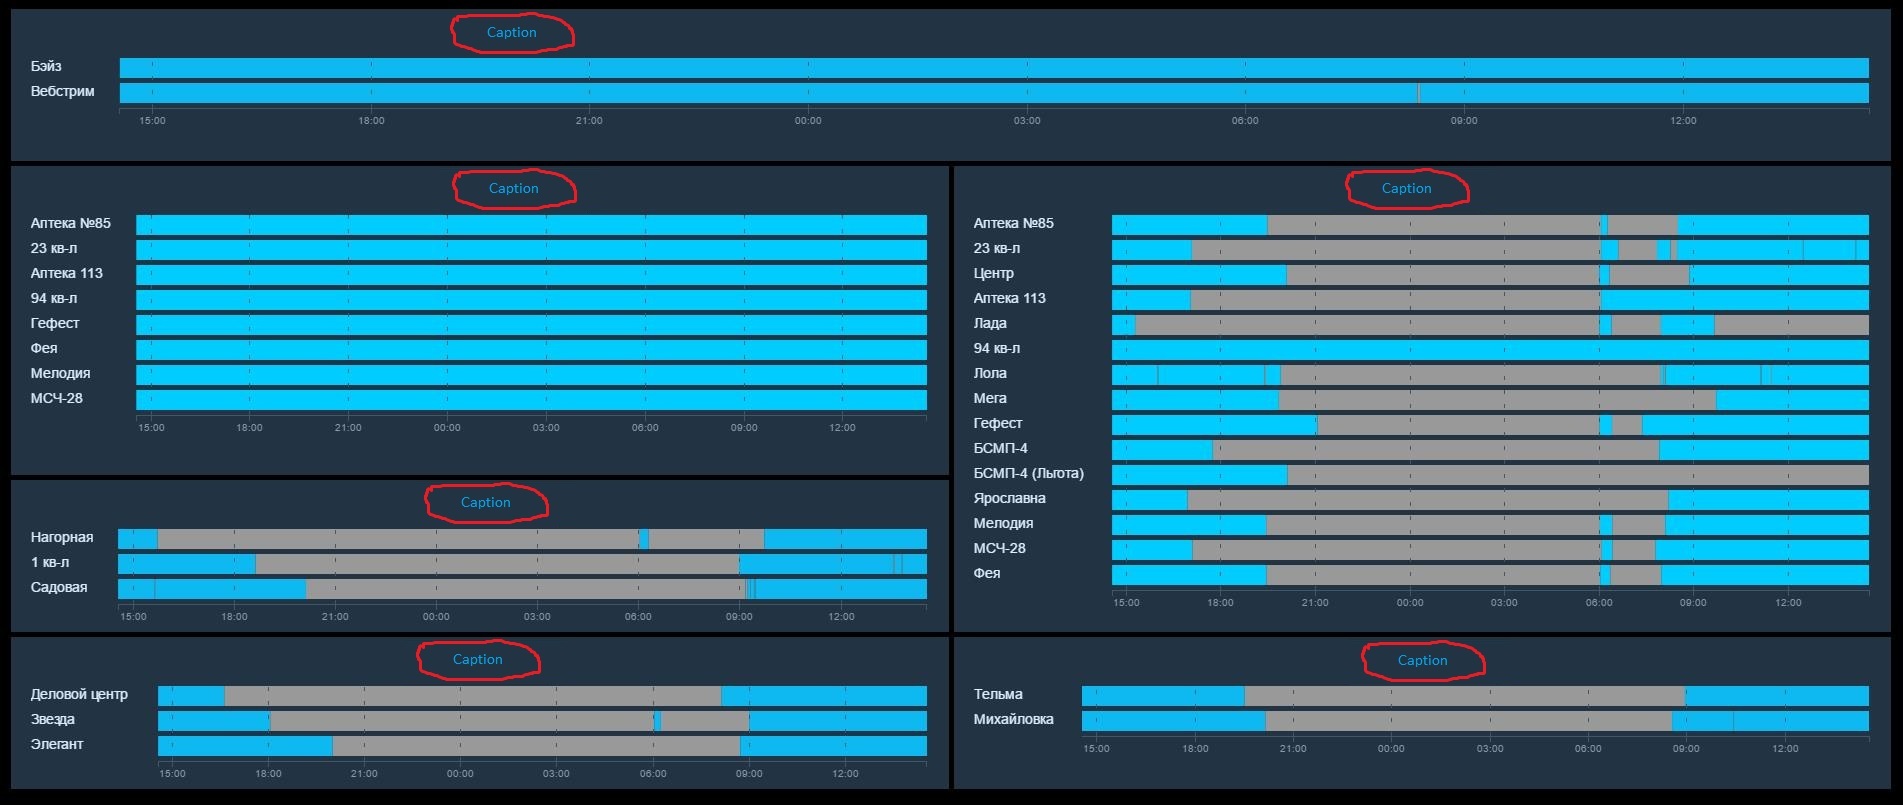
New standard widget: Timeline

Question/New Request:

  1. Possibility to set the text and bar size as request by xsherlock

  2. Possibility to add a group items instead of single item (low priority)

  3. Possibility to assign a colour for a range for example for the temperature I would like to have a range degree from blue to red.
    I.e. 0-16 °C dark blue - 16-18 light blue 18-20 dark green 20-22 green 22-24 green … 30-40 red

Thanks

1 Like

I added an experimental dashboard option to scale the text for all widgets in a given dashboard. There is some measurement issue with the timeline labels though (that’s why it’s experimental :stuck_out_tongue: )
You’ll find it in the dashboard tile settings, Advanced tab.

Ranges and groups, no ETA.

1 Like

That would actually be a really nice Ui for a scheduler as well. Basically just working the other way around. Instead of receiving an item state sending it with the right value at the beginning of a new period/ colour.
Is that something that this widget can be refactored into?

There is a desperate need for a nice scheduler Ui.

Im just getting started with Habpanel - Wow…Amazing Job!

I want to use the Timeline widget for showing my homes power usage , similar to how @xsherlock has done.

How can set the colours so that
RED: is > 4000
Yellow is 1000 - 4000
Green is <1000

?

you would need to do the rule that would evaluate power use on every change. and assigne color o the item variable and then use this variable on the timeline. I do similar thing to determine the power source.

rule "Power Source check"
when
    Item  B_Power_PV_String1 changed or
	Item  B_Power_PV_String2 changed or
	Item  B_Power_AC_Load changed or
	Item  B_Power_Battery_Current_Sum changed  
		
then
	var Number ac = B_Power_AC_Load.state	
	var Number pv1 = B_Power_PV_String1.state
	var Number pv2 = B_Power_PV_String2.state
	var Number bt =  B_Power_Battery_Current_Sum.state
	var Number pv_sum = pv1.floatValue + pv2.floatValue

	if (pv_sum == 0 && bt.floatValue == 0) 			postUpdate(Power_source,"Grid")	
	if (pv_sum == 0 && bt.floatValue < 0) 			postUpdate(Power_source, "Battery")		
	if (ac.floatValue < pv_sum) 					postUpdate(Power_source, "Solar!")
	if ( bt.floatValue < 0 &&  pv_sum > 0) 		    postUpdate(Power_source, "Battery+Solar")
	if (ac.floatValue > pv_sum && pv_sum > 0 && bt.floatValue >= 0 ) 	postUpdate(Power_source, "Grid+Solar")
		
			 
end
1 Like

Hello!
Cool stuff!
What is missing:

  1. Ability to change series in places
  2. Ability to set a title

    Thank you!
3 Likes

Hi, ! is it compatible with mysql persistence ?

I guess, as long as the data is retrieved and accessible with the REST API it should work.

+1 on this.

/Mike

It seems like the timeline widget is not refreshing on its own. Can anybody else confirm this? Other widgets refresh, so I assume there is no broken data stream.

Could you add the ability to specify a title?

Yep, done.

Thanks, it works!

I am using this widget to display the current state of my HVAC system. I am storing the values with rrd4j so I am using integer values 0, 1, 2, and 3 to represent the different states.

Using numerical values, I see some odd behavior. Sometimes the timeline widget displays incorrect values / colors for points in the graph. Take a look at this screenshot, in which I am mousing over the small red sliver near the end of the graph. The displayed value is “0.75”, but that value was never sent to the item, and never shows up in the OH events.log. The item transitions directly from 0 (grey) to 3 (green) at this time.

2017-05-02 15:07:05.524 [ItemStateChangedEvent     ] - upstairs_thermostat_hvac_state changed from IDLE to FAN
2017-05-02 15:07:05.533 [ItemStateChangedEvent     ] - upstairs_thermostat_hvac_state_enum changed from 0 to 3

Perhaps this is a rounding or precision error or something? By the way, right now this seems to happen only for 12h or greater periods. If I use 4h or 8h periods then I don’t see this issue. Pushing it up to 1 week gives even weirder values.

That sounds like a normal rrd4j behaviou. What are your settings for the archives? You see that behaviour on values older then 12 houres. So you should have an archive which covers anything up to 12 houres and at least one for longer times. These other archives do calculate a single value for a time period, the calculation method is decided by the user (or the default).So, if the user decided to calculate those values for longer time steps out of the average of the smaller steps you will see such values. In other words, garbage in garbage out!

Interesting, I’m not that familiar with rrd4j so perhaps I was making some assumptions. So I’m understanding you correctly, this would only be a problem on data that is more than 12 hours old. In my screenshot above, I was examining data that had been recorded 10-15 minutes ago, so I’m not sure if this is the same issue. Also, as mentioned, this problem goes away when viewing the same data on a smaller graph timeline (4h vs 12h).

I’d like to be sure though. How do I check the settings for these archives, and/or set the calculation method for old values? I only need 24h of data, so is there a way configure rrd4j to keep all recorded values for 24 hours instead of 12?

In case it helps, here is my rrd4j.persistence:

Strategies {
    everyMinute : "0 * * * * ?"
}

Items {
    gLogEveryMinute*, gTemperatureSensors* : strategy = everyChange,everyMinute
}

I just took the stated 12 houres from your post, rrd4j can be setup to persist to any desired time. Since you are positing your rrd4j.persist file only, I assume you are using the default setting of this database. This default will persist for every minute over the last 8 houres, the next archive holds the values for each 14 minute step for 644 cycles (count the covered time yourself). Other archives are following.Exemt in the first archive all the values are calculated using the average value of each minute in that timeframe.
That was the default, you can change that in order to have only one archive that holds each Minute value for the last 24 houres! Read the docs for this OpenHab1 addon!
(Edit))
A last point on which I’m not sure: Since rrd4j has values for each minute (or larger steps) you might hover with the mouse over a point in between measurements, resulting in a calculated mean between points.

Well, I tried reconfiguring RRD4J and it still isn’t working as expected. I created the following rrd4j.cfg:

hvac_state.def=GAUGE,60,U,U,60
hvac_state.archives=LAST,0.5,1,10080
hvac_state.items=upstairs_thermostat_hvac_state_enum,downstairs_thermostat_hvac_state_enum

If I understand the documentation, then this should provide logging for every second for a period of one week (10080 minutes), and if multiple values are stored in a period of one minute, it should use the LAST one stored. So there should only ever be integer values stored, since I am only ever setting the item value to 0,1,2,3.

After making these changes, I deleted all rrd4j archives from /var/lib/openhab2/persistence/rrd4j, uninstalled and reinstalled rrd4j binding, and restarted OH. I’m pretty sure the changes took effect since the archives for these two items are now larger than the others.

However, I still see the same behavior. Values for the exact minute where I make an update to the item are displayed in the timeline widget incorrectly. The values seem to be something between the previous state and the new state, e.g. if I move from 0->2 then the value is reported for one minute as “1.9966666…”.

Maybe I’m still making some incorrect assumption about the operation of rrd4j, but I’ve spent enough time on this, I’m just going to switch to mysql persistence instead and see if this still happens.

I guess this could be the issue, but you can see on the timeline widget which exact minute is highlighted.

For example, this is showing from 23:35-23:36:

But yes, it’s a possibility that the timeline widget itself is displaying these values improperly for some reason. I was trying to rule out problems with rrd4j by changing my config, but since I don’t know of a way to inspect the actual data in the database directly, I can’t say if it’s a timeline widget problem or a rrd4j problem.

To check the value strored I’d use the REST Api.
You need to install REST Docs to get this GUI.
In the section persistence you can select the item you are looking for and REST Api will show all stored values for this Item for the selected timeframe.