With the 2.0.0 release behind us, new features can be added again
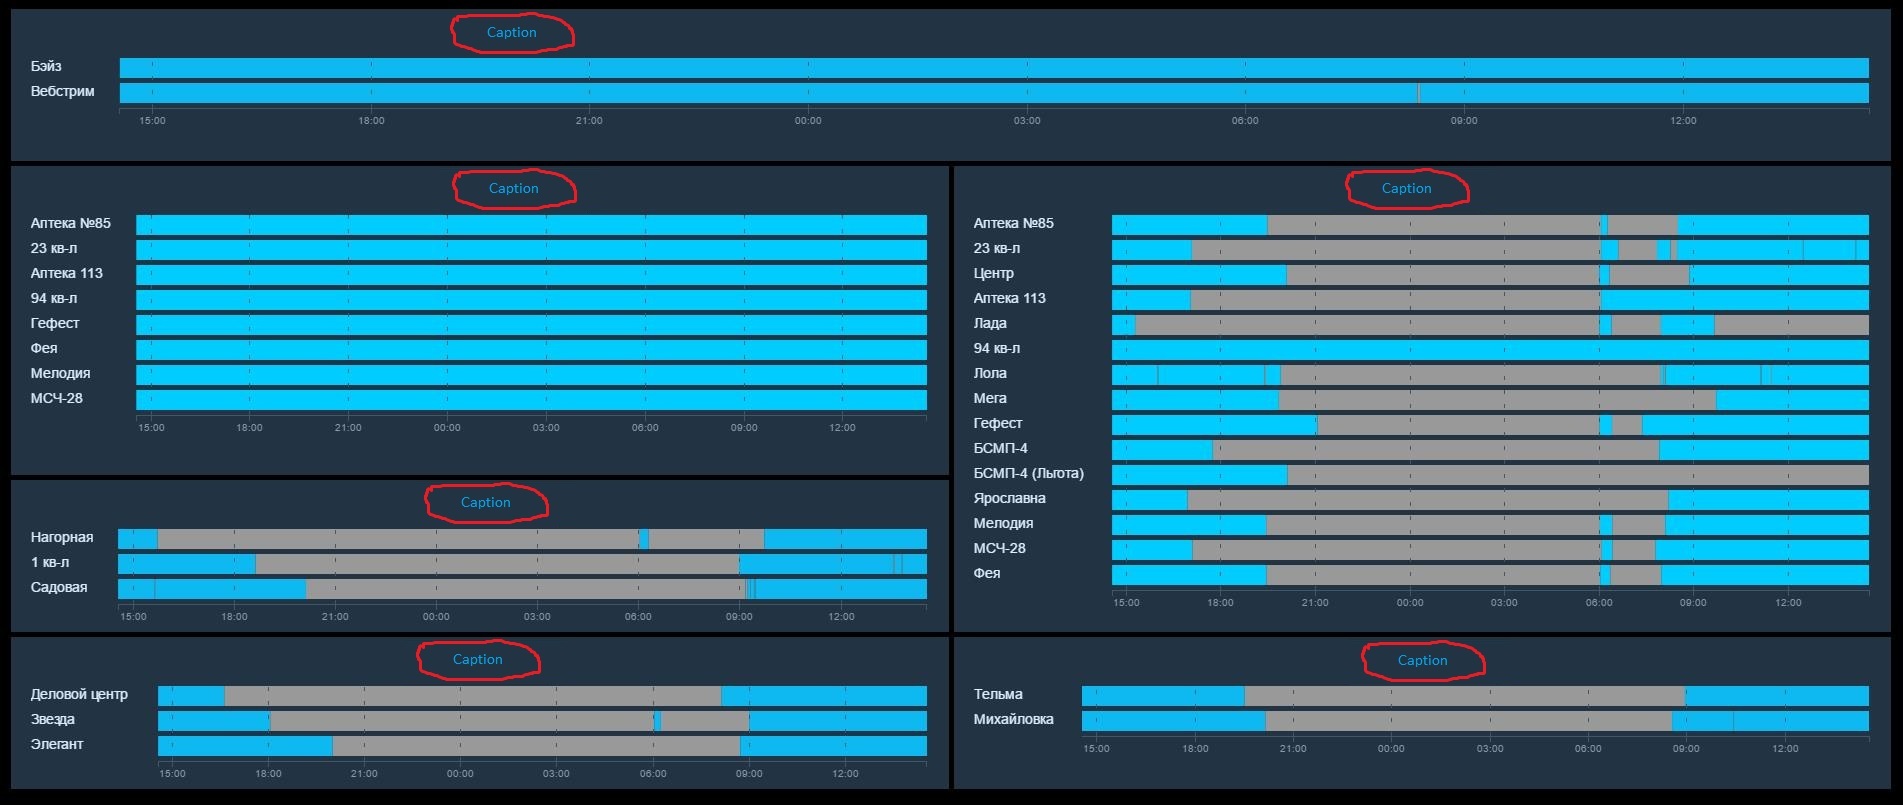
I’d like to ask for help testing the new standard widget I just added: the Timeline, which is basically another type of chart but with colored bars in “swimlanes” - useful to display the state of non-numerical items like switches, contacts and shutters over time.
Wait for the next snapshot build, It should be included in it.
I didn’t test it thoroughly because don’t have a lot of relevant data to graph, therefore I’m looking forward to examples of real-world uses for it (and potential issues here or on GitHub). But it’s looking quite good already
The color palette can be configured per state (for the whole widget, not per item). If the state isn’t in that list, a random color is chosen.
The series are configured similarly to the Chart widget.
Yes you need a persistence service, rrd4j can store numbers, ON/OFF values and maybe others (OPEN/CLOSED etc.), but not strings. I hear influxdb works well and can store strings too.
I have a very good potential use for it. To visualise the power source of the house and show the moment it will switch back to the grid from solar and battery storage. Worked without problem with influxdb.
I only have my usual concern In order to use it on the tablet i need to be able to make it bigger and set the size of the labels below the timeline. Seting the height of the bar would be great as well
On my tablets they are minuscule and hard to read. from any further then 15cm.
Can someone explain me how to install it on an existing OH2 installation ? I Try to update with daily snapshot of OH2.1 but doesn’t see it in widgets menu.
Possibility to set the text and bar size as request by xsherlock
Possibility to add a group items instead of single item (low priority)
Possibility to assign a colour for a range for example for the temperature I would like to have a range degree from blue to red.
I.e. 0-16 °C dark blue - 16-18 light blue 18-20 dark green 20-22 green 22-24 green … 30-40 red
I added an experimental dashboard option to scale the text for all widgets in a given dashboard. There is some measurement issue with the timeline labels though (that’s why it’s experimental )
You’ll find it in the dashboard tile settings, Advanced tab.
That would actually be a really nice Ui for a scheduler as well. Basically just working the other way around. Instead of receiving an item state sending it with the right value at the beginning of a new period/ colour.
Is that something that this widget can be refactored into?
There is a desperate need for a nice scheduler Ui.
you would need to do the rule that would evaluate power use on every change. and assigne color o the item variable and then use this variable on the timeline. I do similar thing to determine the power source.
rule "Power Source check"
when
    Item  B_Power_PV_String1 changed or
	Item  B_Power_PV_String2 changed or
	Item  B_Power_AC_Load changed or
	Item  B_Power_Battery_Current_Sum changed

then
	var Number ac = B_Power_AC_Load.state
	var Number pv1 = B_Power_PV_String1.state
	var Number pv2 = B_Power_PV_String2.state
	var Number bt =  B_Power_Battery_Current_Sum.state
	var Number pv_sum = pv1.floatValue + pv2.floatValue

	if (pv_sum == 0 && bt.floatValue == 0) 			postUpdate(Power_source,"Grid")
	if (pv_sum == 0 && bt.floatValue < 0) 			postUpdate(Power_source, "Battery")
	if (ac.floatValue < pv_sum) 					postUpdate(Power_source, "Solar!")
	if ( bt.floatValue < 0 &&  pv_sum > 0) 		    postUpdate(Power_source, "Battery+Solar")
	if (ac.floatValue > pv_sum && pv_sum > 0 && bt.floatValue >= 0 ) 	postUpdate(Power_source, "Grid+Solar")


end
It seems like the timeline widget is not refreshing on its own. Can anybody else confirm this? Other widgets refresh, so I assume there is no broken data stream.