Thanks Rich… ![]()
I also came across this post of your, which I will check out too.
I always wanted better graphing, hence, looking was forward to graphana… but, it looks like the built-in functionality is sufficient (from what I can see so far).
My whole 1,200 line sitemap is mainly for me to check on values and troubleshoot any problems that may occur.
I have one panel, where I may have used HABpanel; I can’t remember how I did it ![]() … but will a few more in the future.
… but will a few more in the future.
I understand now, after creating some 250 items in OH3, why you prefer to use the UI. Yes, I will use the UI, but for troubleshooting text files are easier and much faster. I still import ‘cleansed’ items files here and there, but the constant filter/search for what I am looking for seems cumbersome. I am not whining, just stating my initial experience; there might be other ways of doing things I haven’t yet discovered.
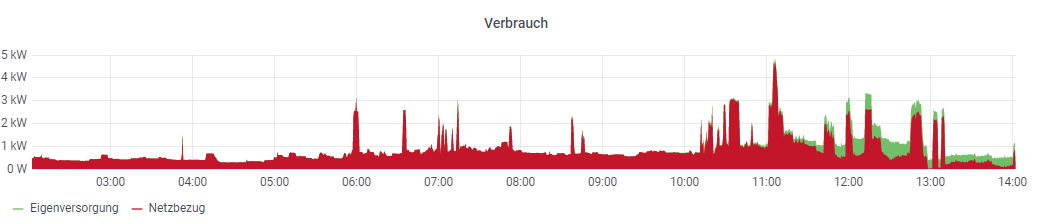
Does any one know, whether this a OH UI chart or not? If not, what may have created it?