
As part of my recent efforts to shore up my homelab environment and make everything easier for the family to use, I’ve been experimenting with Homepage as a dashboard. The thing I like about Homepage is it integrates health and status checks on the dashboard which can save me from needing to rely too much on other monitoring services I use to send me alerts.
Here is a quick tutorial for how I integrated openHAB into Homepage. Installing Homepage and fully configuring that is beyond the scope of this tutorial. See their docs for details. This tutorial will include what you need to configure just for openHAB.
openHAB
Homepage does not have a native widget for openHAB but it does have the customapi widget which can query another service’s REST API and parse it to provide information on the dashboard. Unfortunately it’s pretty basic in what it can do with the retrieved JSON so we need to create a rule in openHAB to update a String Item with simplified JSON for Homepage to consume.
The stats I’ve chosen to show on Homepage are:
- uptime in
DDd HHh MMmformat. - Number of not ONLINE Things/Number of Things
- Number of enabled Rules/Number of Rules
- Number of Items
First, if you haven’t already, create an API token. You’ll need this for the rule and for Homepage.
Next create an Item. I named mine Homepage_Stats.
The following rule will gather the above statistics and update Homepage_Stats with a JSON String containing them. The rule follows. I’ll add it to the marketplace upon request.
configuration: {}
triggers:
  - id: "2"
    configuration:
      cronExpression: 0 0/2 * * * ? *
    type: timer.GenericCronTrigger
conditions: []
actions:
  - inputs: {}
    id: "1"
    configuration:
      type: application/javascript
      script: |-
        // Version 0.1
        const loggerBase = 'org.openhab.automation.rules_tools.PublishStats.'+ruleUID;
        console.loggerName = loggerBase;
        // osgi.getService('org.apache.karaf.log.core.LogService').setLevel(console.loggerName, 'DEBUG');

        console.debug('Homepage rule triggered by '
                      + event.eventName + ' '
                      + event.eventSource + ' '
                      + event.module + ' '
                      + event.triggerType + ' '
                      + event.eventType + '\n'
                      + event.raw.toString());

        // Properties
        const STATS_ITEM = 'Homepage_Stats';
        const API_TOKEN = 'oh.status.YOURTOKEN';

        // Things stats
        const allThings = things.getThings();
        const numThings = allThings.length;
        const numOnlineThings = allThings.filter(t => t.status == "ONLINE").length;
        const numOfflineThings = numThings - numOnlineThings;
        console.trace('Total Things: ' + numThings + ' Online Things: ' + numOnlineThings + ' Offline Things: ' + numOfflineThings);

        // Since we have to pull from the REST API anyway, we can get this value from there
        // const uptime = Quantity(Java.type('java.lang.management.ManagementFactory').getRuntimeMXBean().uptime + ' ms');
        // console.trace('Uptime in seconds: ' + uptime.toUnit('s'));
        let startLevel = 'ERR';
        let uptimeStr = 'ERR;'
        // Get the system info
        try {
          const headers = new Map();
          headers.set('accept', 'application/json');
          headers.set('X-OPENHAB-TOKEN', API_TOKEN);
          const sysinfo = JSON.parse(actions.HTTP.sendHttpGetRequest('https://openhab.koshak.us/rest/systeminfo', headers, 3000));
          console.trace('Raw statistics:\n' + JSON.stringify(sysinfo));

          /** Example
          {
            "systemInfo":{
              "configFolder":"/openhab/conf",
              "userdataFolder":"/openhab/userdata",
              "logFolder":"/openhab/userdata/logs",
              "javaVersion":"21.0.10",
              "javaVendor":"Debian",
              "osName":"Linux",
              "osVersion":"6.8.0-110-generic",
              "osArchitecture":"amd64",
              "availableProcessors":4,
              "freeMemory":853541448,
              "totalMemory":1384120320,
              "uptime":319198,
              "startLevel":100}}
          */

          // Start Level
          startLevel = sysinfo.systemInfo.startLevel;
          console.trace('Start Level: ' + startLevel);

          // Uptime
          const uptime = time.Duration.ofSeconds(sysinfo.systemInfo.uptime);
          const days = uptime.toDays();
          const hours = uptime.minusDays(days).toHours()
          const mins = uptime.minusDays(days).minusHours(hours).toMinutes();
          const seconds = uptime.minusDays(days).minusHours(hours).minusMinutes(mins).seconds();
          uptimeStr = ((days > 0) ? days + 'd ' : "") + hours + "h " + mins + "m"; // + seconds.toString().padStart(2, '0') + ' s';
          console.trace(" Uptime: " + uptimeStr);
        }
        catch(e) {
          console.error('Failed to query REST API for start level and uptime: ' + e);
        }

        // Rules
        const { ruleRegistry } = require('@runtime/RuleSupport');
        const allRules = utils.javaSetToJsArray(ruleRegistry.getAll());
        const numRules = allRules.length;
        const enabledRules = allRules.filter(r => rules.isEnabled(r.getUID().toString())).length;
        const numDisabledRules = numRules - enabledRules;
        console.trace('Total Rules: ' + numRules + ' Num Enabled Rules: ' + enabledRules + ' Num Disabled Rules: ' + numDisabledRules);

        // Items
        const numItems = items.getItems().length;
        console.trace('Num Items: ' + numItems);

        // Build and publish the JSON
        const newState = { 'uptime' : uptimeStr,
                           'startLevel' : startLevel,
                           'things' : numThings,
                           'onlineThings': numOnlineThings,
                           'thingsSummary': numOnlineThings+'/'+numThings,
                           'rules': numRules,
                           'enabledRules': enabledRules,
                           'rulesSummary': enabledRules+'/'+numRules,
                           'items' : numItems
                         };
        console.debug(JSON.stringify(newState));

        items[STATS_ITEM].postUpdate(JSON.stringify(newState));
    type: script.ScriptAction
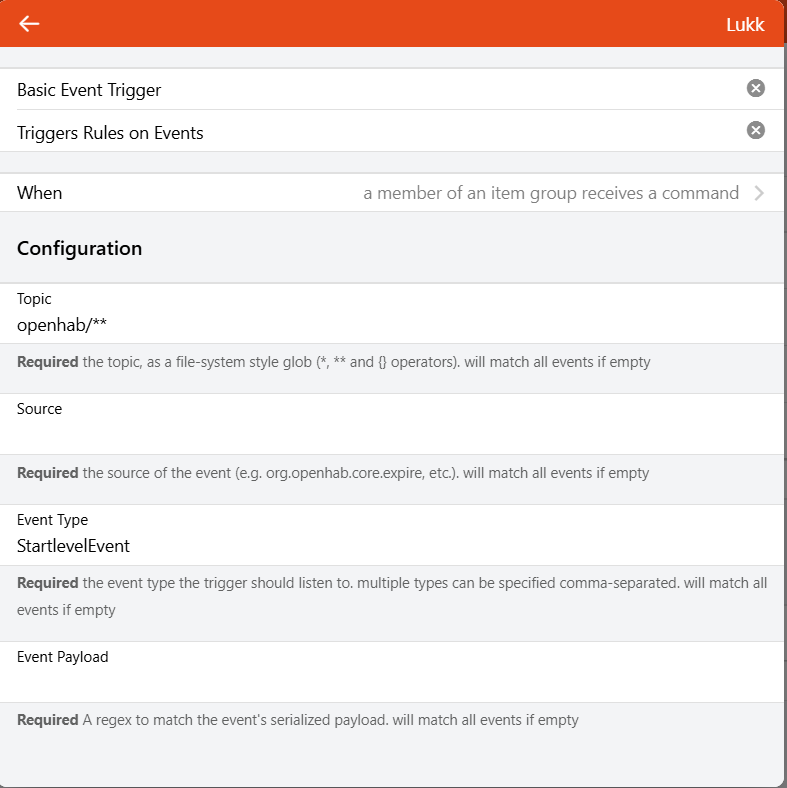
I tried to make this work using generic triggers but I could not get the generic trigger to react on StartlevelEvents and it appears that enabling/disabling a rule doesn’t generate a RuleUpdatedEvent. So I opted for a simply cron trigger instead.
Homepage
Docker Stats
Homepage is able to pull the statistics of the docker container from openHAB. If you are not running openHAB in Docker, you can skip this section.
The first thing you’ll want to do is expose the Docker socket on the host to the Homepage container. If they are running on the same host, that’s as easy as mounting /var/run/docker.sock into the Homepage container. If not, I use a Docker socket proxy for this. My Ansible task to spin this up right now is:
- name: Pull and run the docker proxy
  community.docker.docker_container:
    detach: true
    env:
      CONTAINERS: "1"
      SERVICES: "1"
      TASKS: "1"
      POST: "0"
    hostname: "{{ ansible_fqdn }}"
    image: ghcr.io/tecnativa/docker-socket-proxy:latest
    log_driver: "{{ docker_log_driver }}"
    name: docker_proxy
    published_ports:
      - "{{ docker_proxy_port }}:2375"
    privileged: true
    recreate: true
    restart_policy: unless-stopped
    state: started
    volumes:
      - "/var/run/docker.sock:/var/run/docker.sock:ro"
The “ro” on the mount and “POST: 0” makes this read only. I run this on all my hosts running Docker so Homepage can query the stats for all my services.
On the Homepage side, you’ll need to edit docker.yaml and add an entry:
openhab_host:
  host: <ip or hostname of docker socket proxy>
  port: 2375
Adding to the Dashboard
You’ll edit services.yaml and add an entry for openHAB. We will set up a serviceMonitor which will attempt to make an HTTP request to your openHAB server and display how long that takes in the upper right corner of the widget. We will also add a container which adds another status to the upper right showing the online status of the container and clicking on that will show statistics of that container (e.g. RAM usage). Finally, we’ll add a widget to show those stats we set up above from the Homepage_Stats Item.
The full yaml:
    - openHAB:
        icon: openhab.png
        href: https://<IP or hostname and port of openHAB>
        siteMonitor: https://<IP or hostname and port of openHAB>
        server: openhab_host # name of the server in docker.yaml, omit if not using docker
        container: openhab # name of the openHAB container, omit if not using docker
        widget:
          type: customapi
          url: https://<IP or hostname and port of openHAB>/rest/items/Homepage_Stats/state
          headers:
            X-OPENHAB-TOKEN: oh.status.YOURTOKEN
          mappings:
            - field: uptime
              label: Uptime
            - field: thingsSummary
              label: Things
            - field: rulesSummary
              label: Rules
            - field: items
              label: Item
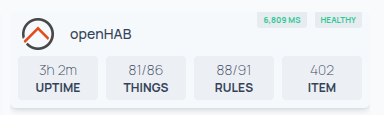
That’s it. It will look like this on Homepage.
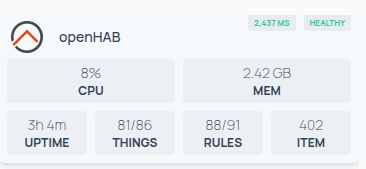
If you click on the Docker container status (“HEALTHY”) it will be:
This is probably the last openHAB facing work I’m going to be doing while shoring up my homelab so there probably won’t be any more tutorials like these unless requested.

 I just work here.