Openhab config hygiene checker. Due to a bad configuration code (which works), the system becomes slow and starts unnecessary error messages during start-up and running. Is any way to identify and check the overall health of the setup? Typically on Raspberry Pi users face slowness due to lack of resources.
It’s an NP-Complete problem with too many variables. There is not and is likely not to be any sort of config checker like that beyond what already exists with the syntax checking during load and errors you see in the logs. It would take years to check even the most simple of configurations.
But…
These are not unnecessary. These are your config checker. If you start to see error messages they indicate that there is a problem. Most of the time, the problem is caused by your config. Look at these, understand what they say, and change your config as necessary to avoid them. If you need help, post a thread with the logs and the the behaviors you are seeing (and other important info like OH version and how it was installed on what OS) and we will be happy to help.
Thanks, Rich
My Set-Up is : Raspberry Pi 3 b+ with raspbian buster using SD card 64 GB
using apt-cache showpkg openhab2
Package: openhab2 Versions:2.5.6-2 (more details in attched file )
Count of Items:1256
Count of things:99
Error Details log are attached
Errors during the boot process make the boot process slow. Openhab restart takes around 5 min.
4 sets of error
set 1 : [WARN] [me.core.internal.events.EventHandler] - Dispatching event to subscriber
When this warn starts, system response becomes very slow. system hangs. New thing /item/ Sitemap file compilation takes 3- 8 min . The only option is to restart.
I learned and tried a few solutions from forums but no use. Post restart after 10-12 hrs this issue comes back.
Set2 :
[ERROR] [e.internal.WriterInterceptorExecutor] - MessageBodyWriter not found for media type=text/event-stream, type=class org.glassfish.jersey.media.sse.OutboundEvent,
A new entry today. Restarted system and now system is giving this error.
Set 3 --during Openhab boot process
[ERROR] [org.quartz.core.ErrorLogger ] - Job (DEFAULT.Timer 2 2020-07-11T01:54:07.827+05:30: Proxy for org.eclipse.xtext.xbase.lib.Procedures$Procedure0: [ |
This issue comes during openhab boot time.
Set 4 : during Openhab boot process Post boot no issue
[ERROR] [nal.common.AbstractInvocationHandler] - An error occurred while calling method ‘QueryablePersistenceService.query()’
{openhab_warn_error.txt (35.1 KB) openhab_version.txt (42.5 KB)
This is a symptom of some other root problem. It is not the problem itself. What is the CPU doing when this warning occurs? RAM usage? Is openHAB consuming all the CPU or some other process? For example, Grafana is known to bring a computer to it’s knees when rendering pngs of the graphs when using the old pahntomjs plug-in.
What this warning means is that it’s taking longer than expected to send an event to the event bus I think. What ever is making the rest of the system slow is likely making this slow too. And it’s not necessarily openHAB that’s doing it.
This error is coming from Jersy which is the web server that serves the UIs. Did you happen to close BasicUI, PaperUI or one of the phone apps when this error occurred? The name of it implies it tried to send something to a client and failed, which would happen if that client abruptly disconnects.
This is one that can be ignored. When openHAB reloads .rules files, the Timers that are in that file remain but become orphaned. When the Timers finally go off, the context is gone and an exception is thrown.
This implies some sort of connectivity issue between openHAB and your persistence service. What are you using?
Do you have any while loops or long Thread sleeps in your rules? Review (OH 1.x and OH 2.x Rules DSL only] Why have my Rules stopped running? Why Thread::sleep is a bad idea and see if anything there applies.
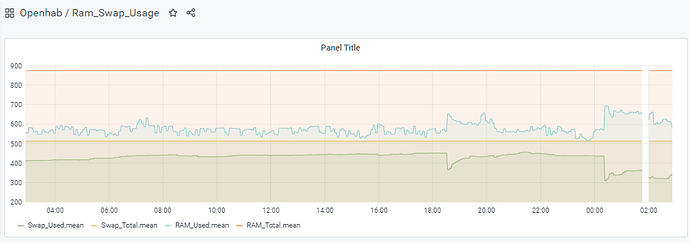
Reason I am considering openhab2 is my Ram & Swap usage is normal . My internet connection is stable .
In my system set up except Openhab 2 all others are docker containers.Last month i tried Grafana rendering but I understoon using Raspberry pi 3b+ rendering is not good idea . So stoped all fetching grafana things in openhab .
sleep in rules I need to check.
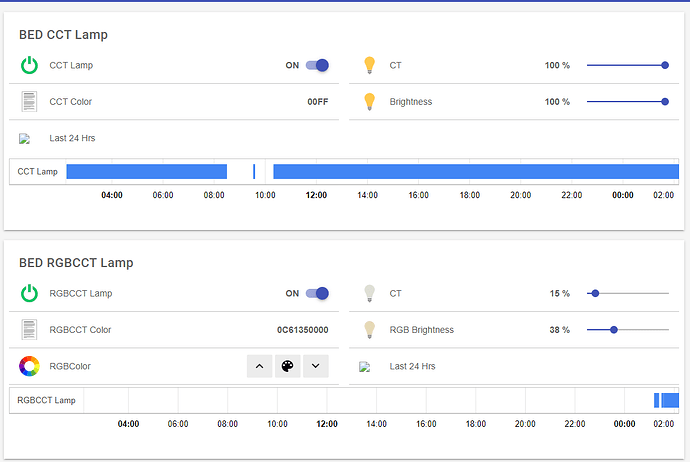
Yes I am working & testing on Tasmotised wipro RGBCCT bulb integration with openhab . now my openhab is configured for CCT and RGB CCT using mqtt 2.5.
CCT & RGBCCT bulb received with alexa in offer . these with tuya firmware . So updated with Tasmota.
“Normal” swap usage would be 0. I see over 400 MB of swap being used for most of the time of that chart. That means almost 1/3 of all the programs you are trying to run do not fit in RAM and they are running off of the SD card.
That’s a huge amount of stuff to be running on one RPi3 and if I’m reading that chart correctly you are basically over subscribing the available RAM on that machine. You’re thrashing. All the RAM gets used up and then everything slows down as RAM is swapped to and from the disk.
And running everything in containers with Portainer is only going to require more RAM than would be required otherwise.
You don’t have an openHAB problem. You are treating the RPi as if it were a server class machine. It’s a wonder it works as well as it does.
This topic was automatically closed 41 days after the last reply. New replies are no longer allowed.


