I created a small collection of scripts to generate my own graphs and thought to share them with you. You can find them in my github repo.
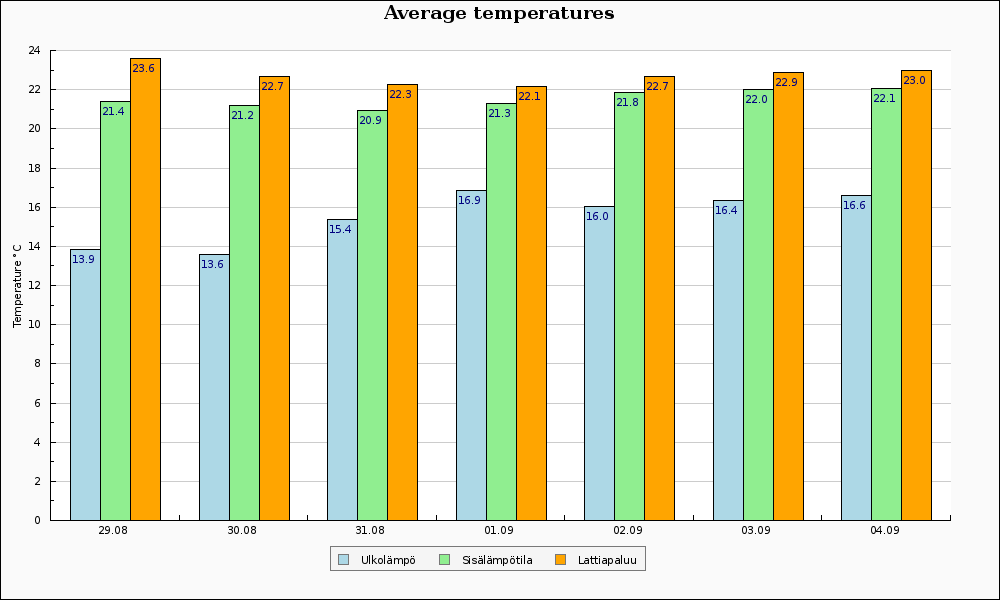
It all started with just one php file that used the JpGraph library and hard coded configuration. Then I tried to make it more modular and useful to others. Now I use it to visualize my heat pumps temperatures and functioning. For example if I view historical data OPJGraph calculates average values for temperatures and total times for state items. I can check how many minutes the heat pump was producing hot water a week ago ![]()
I won’t go into details configuring all that is needed but If you want to try it out there’s few prerequisites:
- Web server with PHP and GD extension enabled. I’m using Apache2 with PHP 7.
- JpGraph library. I have version 4.2.2.
- MySQL Persistence. At this point only MySQL database is supported.
When all the above sorted out it’s time to clone my repo and configure it to be served by your web server. Just remember security as I stated in the readme:
As opjgraph.ini file contains your database username and password remember to set up your web server not to allow direct view of .ini files.
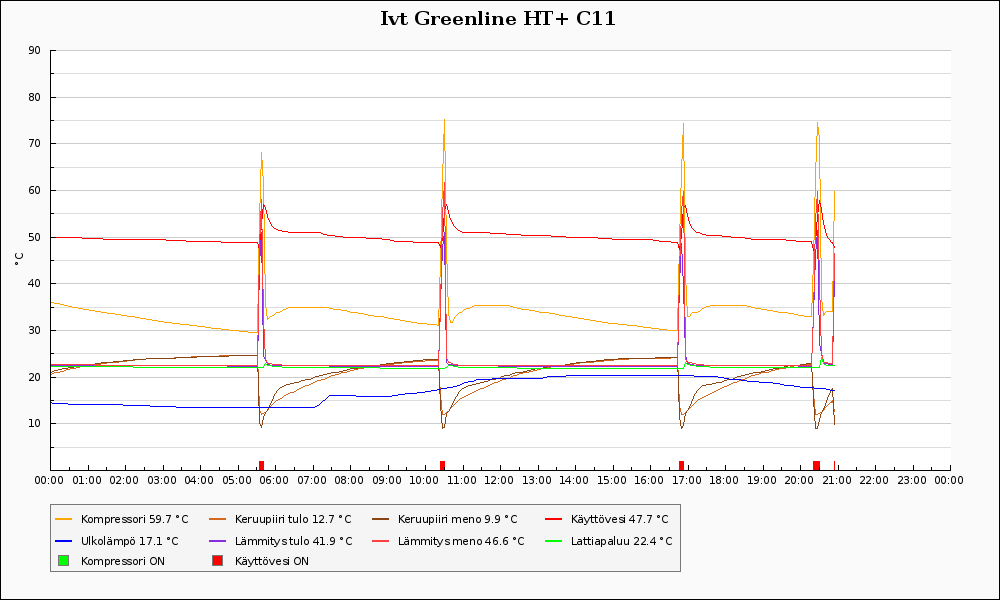
I have Apache configured to serve this on the default port (:80) so it’s just to point my browser to http://my.webserver.ip.number/. Script defaults to todays graphs:
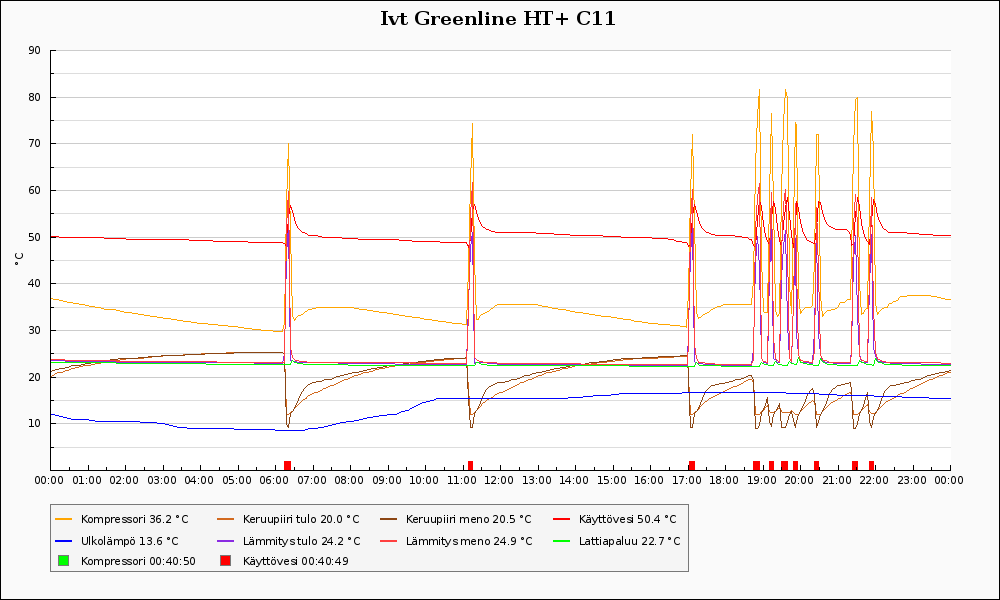
What happened yesterday? Here you can see the calculated averages and “ON” times:
I’ve linked only the graphs itself and not a screenshot from the whole page. There’s buttons and selections to view today’s and historical data. Selections are automatically populated with the dates from your MySQL database items.
If you want to embed these graphs for example in your sitemap it’s possible by setting an image item to point to http://my.webserver.ip.number/scripts/graph.php. Graph.php accepts GET parameter “period” to access graphs from different dates.
- ./graph.php?period=today
- ./graph.php?period=last24h
- ./graph.php?period=2018-08-25
Hope you find this interesting and useful. ![]()