milo
December 2, 2018, 9:33am
1
Platform information:
Hardware: CPUArchitecture/RAM/storage
OS: what OS is used and which version
Java Runtime Environment: which java platform is used and what version
openHAB version: 2
Issue of the topic
default.item
Group group_test
Number MQTT_number_weewx_outTemp_C "Aussentemperatur [%.1f °C]" (group_test) {mqtt="<[mosquitto:weather/outTemp_C:state:default]"}
Number MQTT_number_weewx_inTemp_C "Innentemperatur [%.1f] °C" (group_test) {mqtt="<[mosquitto:weather/inTemp_C:state:default]"}
persistance
MQTT_number_weewx_outTemp_C : strategy = everyMinute, restoreOnStartup
MQTT_number_weewx_inTemp_C : strategy = everyMinute, restoreOnStartup
sitemap
Chart item=test period=h refresh600
where is my failure???
vzorglub
December 2, 2018, 9:44am
2
group_test* : strategy =…
milo
December 2, 2018, 10:07am
3
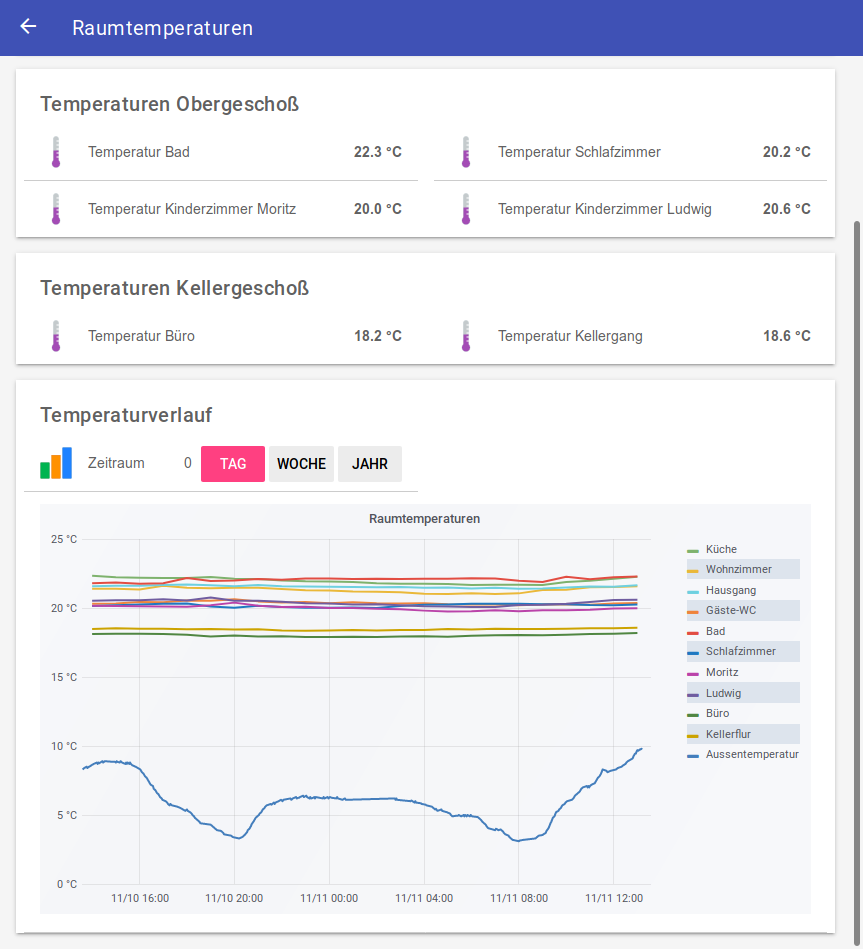
how can i format the chart that it looks like
is there any guide?? especially i want this buttons for the differnet timeperiod.
Thanks
mpampinos
December 2, 2018, 10:08am
4
Chart item=group_test period=h refresh=600
milo
December 2, 2018, 10:13am
5
how can i format the chart that it looks like
is there any guide?? especially i want this buttons for the differnet timeperiod.
Thanks
mpampinos
December 2, 2018, 10:19am
6
items
Number Weather_Chart_Period "Chart Period"
sitemap
Frame {
				Switch item=Weather_Chart_Period label="Chart Period" icon="line" mappings=[0="Hour", 1="Day", 2="Week", 3="month", 4="2month"]
				Chart item=group_test period=h refresh=600000 visibility=[Weather_Chart_Period==0, Weather_Chart_Period=="NULL"]
				Chart item=group_test period=D refresh=3600000 visibility=[Weather_Chart_Period==1]
				Chart item=group_test period=W refresh=3600000 visibility=[Weather_Chart_Period==2]
				Chart item=group_test period=M refresh=3600000 visibility=[Weather_Chart_Period==3]
				Chart item=group_test period=2M refresh=3600000 visibility=[Weather_Chart_Period==4]
			}
1 Like
milo
December 2, 2018, 10:54am
7
But I learned that I need to create a chart outside openhab if I like to format it. Inside with the basic ui it is impossible to format it individually.
Topic can be closed