Using loki+promtail+grafana for Openhab system and log monitoring

Hello all,

This small tutorial explains some of the basics of setting up a log and system monitoring environment. I use this in case of issues with my openhab setup, to analyse what went wrong, when to find a solution. It’s difficult to do this from the text files and sometimes openhab stops being happy due to platform issues (low on RAM). So that’s why I integrated both log and platform monitoring in a grafana dashboard. It’s not easy to figure out all the steps, so I wanted to share my experience and hope other can benefit from it.

I do log monitoring with:

I do system monitoring with:

  • Node exporter as a platform (ex: raspberry pi) metrics (available ram) exporter
  • Prometheus as metrics scraper and ‘database’

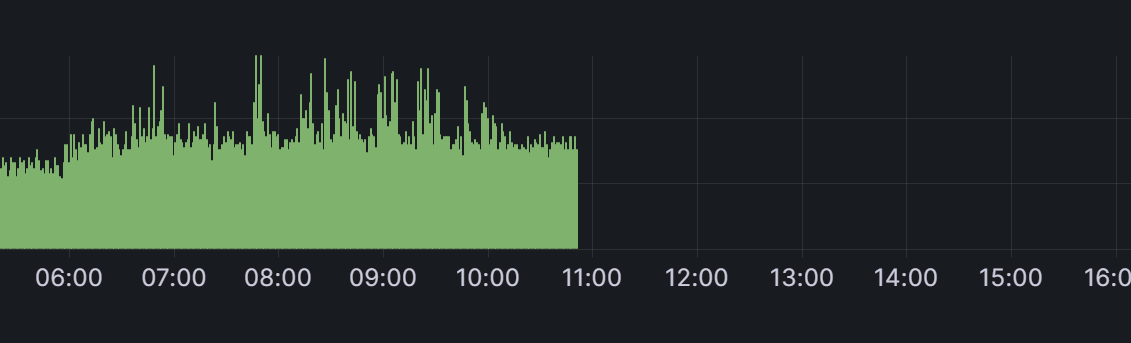
To start this topic with some graphics, this is my dashboard in Grafana:

Note: I’m currently migrating from textual item, rule and thing definitions to UI so I got some errors to tackle. But that just makes the visuals more interesting :wink:

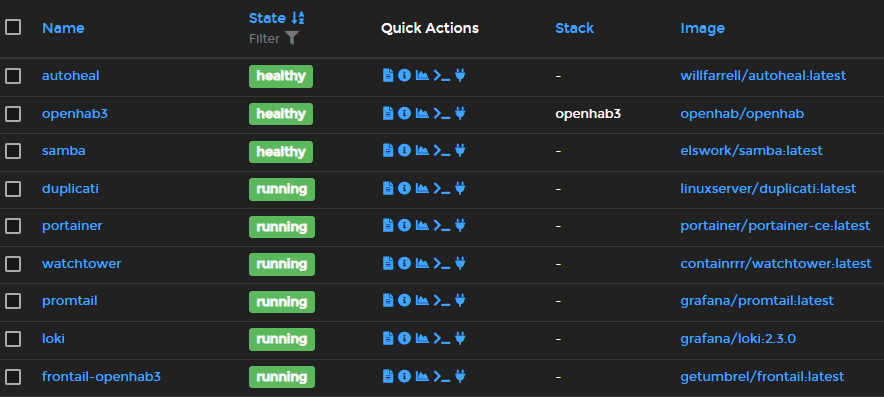
I’m not going to go over the details on how to install the separate components. There are dedicated articles about this on the web. I would however recommend installing these (and openhab for that matter) as a docker container. This topic is specifically meant to explain the integration of openhab with the other components.

There is no configuration specific to openhab for Node exporter and prometheus. So you should be able to install and configure these components using internet sources. When successfull, these indicators from my dashboard are ready to put in your dashboard:

Same goes for Loki.

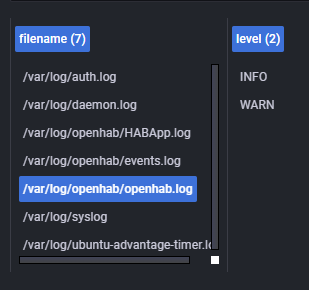
Promtail needs access to the openhab.log and events.log files. I run this component in docker and mount the user data volume from my openhab docker container into the promtail container (in the /logs folder in promtail container). Then you need a configuration file for promtail in order to create a job for each file and tell promtail how to parse the log file lines. This is my configuration:

server:
  http_listen_port: 9080
  grpc_listen_port: 0

positions:
  filename: /tmp/positions.yaml

clients:
  - url: http://server.running.loki:3100/loki/api/v1/push

scrape_configs:
- job_name: openhab-events
      
  pipeline_stages:
    - regex:
        expression: '^(?P<time>.+) \[(?P<level>[a-zA-Z]+) ?\] \[(?P<component>[a-zA-Z \.]+)\] - (?P<output>.+)$'
    - labels:
        level:
        component:
    - timestamp:
        format: "2021-06-22 15:04:03.828"
        source: time
    - output:
        source: output

  static_configs:
  - targets:
      - localhost
    
    labels:
      job: openhab-events
      __path__: /logs/logs/events.log
      
- job_name: openhab-system

  pipeline_stages:
    - multiline:
        firstline: '^(?P<time>.+) \[(?P<level>[a-zA-Z]+) ?\] \[(?P<component>[a-zA-Z \.]+)\] - (?P<output>.+)$'
        max_wait_time: 1s    
    - regex:
        expression: '^(?P<time>.+) \[(?P<level>[a-zA-Z]+) ?\] \[(?P<component>[a-zA-Z \.]+)\] - (?P<output>.+)$'
    - labels:
        level:
        component:
    - timestamp:
        format: "2021-06-22 15:04:03.828"
        source: time
    - output:
        source: output

  static_configs:
  - targets:
      - localhost
    
    labels:
      job: openhab-system
      __path__: /logs/logs/openhab.log

As for Grafana. After installation and basic setup, the first thing you need to do is configure a data source for Loki and one from Pormetheus. This is as simple a creating a data source and inserting the URL to both components. Now your Grafana has access to the data that is scraped.

And now for the dashboard. Start by doing something simple as importing an existing template into grafana for the node exporter part. I would advise this one: Node Exporter Full dashboard for Grafana | Grafana Labs

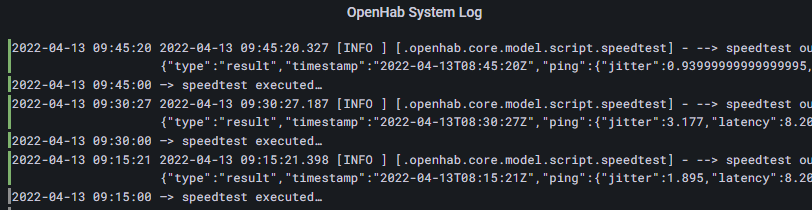
You should be able to explore your openhab data and do simple queries like this:

If you want to copy my dashboard. Here is the json template:
Grafana openhab dashboard.json (25.2 KB)

Grafana also allows for alerting when certain numbers go beyond thresholds. I haven’t gotten to that part yet.

9 Likes

Hi,

Can you give anymore detail on how to connect my logs from OpenHAB ruinning on a Pi , to Promtail running in a Docker on Windows.

I have managed to setup Grafana, Loki, and Promtail as Docker containers.

I can log into Grafana and add a Loki dataset.
I get a confimation of “Data source connnected and labels found”, but I do not think any logs are being imported.

I have imported your dashboard, but no data

I think my setup differs from yours by being run on my Windows machine and trying to pull the data from a network location.

My promtail-config.yaml looks like this so far. I’m hoping there is a simple syntax problem or something else I’m missing to define the location of the openhab logs.

server:
  http_listen_port: 9080
  grpc_listen_port: 0

positions:
  filename: /tmp/positions.yaml

clients:
  - url: http://localhost:3100/loki/api/v1/push

scrape_configs:

- job_name: openhab-events
      
  pipeline_stages:
    - regex:
        expression: '^(?P<time>.+) \[(?P<level>[a-zA-Z]+) ?\] \[(?P<component>[a-zA-Z \.]+)\] - (?P<output>.+)$'
    - labels:
        level:
        component:
    - timestamp:
        format: "2021-06-22 15:04:03.828"
        source: time
    - output:
        source: output

  static_configs:
  - targets:
      - localhost
    
    labels:
      job: openhab-events
      __path__: "W:/var/log/openhab/events.log"


- job_name: openhab-system

  pipeline_stages:
    - multiline:
        firstline: '^(?P<time>.+) \[(?P<level>[a-zA-Z]+) ?\] \[(?P<component>[a-zA-Z \.]+)\] - (?P<output>.+)$'
        max_wait_time: 1s    
    - regex:
        expression: '^(?P<time>.+) \[(?P<level>[a-zA-Z]+) ?\] \[(?P<component>[a-zA-Z \.]+)\] - (?P<output>.+)$'
    - labels:
        level:
        component:
    - timestamp:
        format: "2021-06-22 15:04:03.828"
        source: time
    - output:
        source: output

  static_configs:
  - targets:
      - localhost
    
    labels:
      job: openhab-system
      __path__: "W:/var/log/openhab/openhab.log"

Hello MartOs

I see a couple of possible issues with your Promtail configuration.

First:

clients:
  - url: http://localhost:3100/loki/api/v1/push

When you run anything in a docker container, ‘localhost’ is always referring to the docker container itself, not the host on which you run docker. So try replacing this with the IP address of your docker host. Or I think host.docker.internal also references the host (maybe only in docker for windows)

Second possible issue:

      __path__: "W:/var/log/openhab/events.log"

and the same for the system log. Is “W” a mapped network drive on your windows host machine? If yes then this is not going to work. You need to “mount” that drive into you docker container as a volume. I don’t know if this is possible using a mapped network drive (and is it is, I don’t know how stable it is going to be). For mounting windows folders into a docker container: Mounting folders to a Windows Docker container from a Windows host – Sarcastic Coder

In order to verify if the log files are readable by the container, log into the container by console and try to read the path. If you are new (and even if you are an expert…) to docker, I would advise to install portainer. It allows doing most of this stuff using a webgui.

However, I would advise to run promtail on the same host as where you run openhab. It’s a very lightweight package so shouldn’t be a problem. That way, you only need to mount a local directory into the container which avoids any networking issues messing up promtail.

Hi Mathias,

Thanks for your help.
I am very new to this and finding the documentation almost impossile to understand.

I am running openHab on a Pi 4 with openhabian, so I’m not using Docker for my Openhab system. Is it the binary I need to install here using the instructions on this page to run Promtail on the Pi?

$ curl -O -L "https://github.com/grafana/loki/releases/download/v2.4.2/loki-linux-amd64.zip"
# extract the binary
$ unzip "loki-linux-amd64.zip"
# make sure it is executable
$ chmod a+x "loki-linux-amd64"

You could install the binary of promtail yes. I have never done that so I suggest you follow whatever documentation is available on the web, for example: Install Promtail on Ubuntu 20.04 | Lindevs

Or you could install docker on the openhabian host.

The link that you gave with the commands is for installing loki, not promtail.

Hello,

I don’t know anything about loki and all this, but when I see this :

loki-linux-amd64.zip

it will not work for a raspberry pi, you need the arm version.

That was just the example. There is a list of OS and hardware options. I think it is simillar to the link posted by Mathias. And promtail is in the same place as loki

Thanks for all the help. I now have it working.

Installed the Promtail binary with promtail-linux-amd.zip and the instructions posted my Mathias
My promtail yaml is

server:
  http_listen_port: 9080
  grpc_listen_port: 0

positions:
  filename: /tmp/positions.yaml

clients:
  - url: http://10.0.0.23:3100/loki/api/v1/push

scrape_configs:
- job_name: system
  static_configs:
  - targets:
      - localhost
    labels:
      job: varlogs
      __path__: /var/log/*log
- job_name: openhab-events
      
  pipeline_stages:
    - regex:
        expression: '^(?P<time>.+) \[(?P<level>[a-zA-Z]+) ?\] \[(?P<component>[a-zA-Z \.]+)\] - (?P<output>.+)$'
    - labels:
        level:
        component:
    - timestamp:
        format: "2021-06-22 15:04:03.828"
        source: time
    - output:
        source: output

  static_configs:
  - targets:
      - localhost
    
    labels:
      job: openhab-events
      __path__: /var/log/openhab/events.log
      
- job_name: openhab-system

  pipeline_stages:
    - multiline:
        firstline: '^(?P<time>.+) \[(?P<level>[a-zA-Z]+) ?\] \[(?P<component>[a-zA-Z \.]+)\] - (?P<output>.+)$'
        max_wait_time: 1s    
    - regex:
        expression: '^(?P<time>.+) \[(?P<level>[a-zA-Z]+) ?\] \[(?P<component>[a-zA-Z \.]+)\] - (?P<output>.+)$'
    - labels:
        level:
        component:
    - timestamp:
        format: "2021-06-22 15:04:03.828"
        source: time
    - output:
        source: output

  static_configs:
  - targets:
      - localhost
    
    labels:
      job: openhab-system
      __path__: /var/log/openhab/openhab.log

Sending to Loki running on my Windows Docker, then reading from Grafana also running in Windows Docker.

I now wonder if I should move Loki and Grafana to another Pi (not the openHAB one) that is always on. Or will my Windows software reliably scrape old logs when I start it up making this unnecesary?
I saw somewhere that running a database like this on SD card systems can be a bad idea because of the many writes. Any thoughts? I’d rather not need to setup an SSD system.

Loki should be always on since promtail will sent new data to Loki while Openhab generates new data in its log files. Grafana on the other hand can be powered on as you want since it will make it’s own connection to Loki on demand.

I have 4 pi’s in my house that all run everything on docker. 2 out of 4 are SSD equipped and the other use a simple SD. I use a docker app called duplicati to take daily automated backups. I haven’t had SD card issues yet. I run a postgresql database on one of the SD cards. I’m not sure if loki is running on SD or SSD. But in the case of loki, I don’t really care. I don’t mind if I lose my Loki data since it’s only used to troubleshoot or monitor the system. For me it doesn’t matter if it’s suddenly an empty shell. I think it’s also by default set to 30 days data retention (not sure).

I bet Loki also uses some sort of memory caching system to avoid writing to disk to much.

So all in all, I would still advise you to run Loki on a pi. I would try to avoid putting to much on the pi that runs openhab. If you have a pi4 with 8Gb of RAM to run openhab on, then you are pretty safe. I run Loki on that Pi among other things:

I’m currently implementing this, but I’m having issues getting the “ERROR” Level to appear in the tags.
I suspect this is related to the fact that in the openhab.log file we have:
image
image

[INFO ] ← this works
[WARN ] ← this works
[ERROR] ← this does NOT work

image

I am pretty sure it’s related to the regex string, but regex is a dark art to me.
I’ve tried the ones in the previous replies in this post and currently have:

    - regex:
        expression: '^(?P<time>.+) \[(?P<level>[a-zA-Z ]+)?\] \[(?P<component>[a-zA-Z \.]+)\] - (?P<output>.+)$'

Can someone help me with the correct expression to resolve this?

Thanks,
Richie

Hi,
Just an update on this.
It looks like the regex IS correct, as they all return correct values when tested on regex101: build, test, and debug regex
It looks like the issue must be in either PromTail or Grafana.
Some logs are also displayed in Grafana as:


If you look closely at it you can see that the date, level and component are also shown in what should be just the “output”

Thanks,
Richie

Hi all,

Just finally getting around to playing with this now. All is installed and working well, but I’m looking for some help tuning the dashboards and troubleshooting a few things.

Before that though, I thought I should add this to this thread:
If you edit /userdata/etc/log4j2.xml you can remove the truncation of the component field. This makes it make a lot more sense in Grafana as you get the full component instead of something like org.openhab.core.mod....
By default it is truncated so that the default logging looks neat in Frontail.

Change %-36.36c to %c

So the line that looks like

<PatternLayout pattern="%d{yyyy-MM-dd HH:mm:ss.SSS} [%-5.5p] [%-36.36c] - %m%n"/>

becomes

<PatternLayout pattern="%d{yyyy-MM-dd HH:mm:ss.SSS} [%-5.5p] [%c] - %m%n"/>

I’d love to know more about this pattern and how to manipulate it it useful ways if anyone can share any tips.

Issue 1

The first problem I have when I plug in the example dashboard in the original post is that lots of my panels show a warning

Too many outstanding requests

Panels come and go, I can’t find any rhyme or reason as to when this happens. Sometimes it will show me last 24hrs, then other times it can’t even show last 5 mins.

Issue 2

How can I search by text? Seems like it should be simple, but how can I simply type a search term and show all results?

Issue 3

Can someone describe a good way to exclude certain items to reduce noise in my logs?

Issue 4

Resources. The official docs for Grafana are mind bending for a noob like me. Are there any resources or videos that are a bit easier to get started?

Hi @MathiasVDA,

I just try to have the same setup, and I already have it up and running. Thx for your effort to document that here!
Unfortunately though, promtail seems to have issues with the log rotation. Whenever the log is rotatet, it stops sending data. Did you ever experience such a behaviour?

Hello Stone, no I don’t have any issue with the log rotation. I see these lines in the log of promtail that I suspect have to do with log rotation:

ts=2023-08-16T02:03:13.670126703Z caller=log.go:168 level=info msg="Re-opening moved/deleted file /logs/logs/events.log ..."
ts=2023-08-16T02:03:13.670299886Z caller=log.go:168 level=info msg="Successfully reopened /logs/logs/events.log"

Hm, seems to be bad luck for me then … guess when my events.log was rotated …

What version of promtail are you running?