Grafana InfluxDB - Help with queries and creating graphs and charts

I have recently managed to setup Grafana, InfluxDB, Promtail, and Loki on two Pis

See here for setting up Promtail and Loki for logs

See here for InfluxDB and Grafana (although it’s a bit easier than this post makes it out to be by using the openhabian-config menu option)

And use this widget in the OpenHAB UI. It can be installed from the OpenHAB AddOns page

Pi A
Openhab and Promtail on main SD card
InfluxDB data being stored on attached 64GB SSD

Pi B
Loki and Grafana running on main SD card
I also use this Pi for Plex, storing my media on external drive

This is all working now and Grafana is seeing all data.

My question is about querying the InfluxDB in Grafana.
I seem to only be able to select one item’s data at a time

For example, how do I make queries from all battery levels, or all light brightnesses without having to manually add each one?

1 Like

Press “+Query” (bottom left) to add multiple items. You can set their parameters individually (e.g. color, transform, etc…)

Hi,
Thanks for replying, but adding one at a time is exactly what I am trying to avoid. I want to be able to say ‘any items including “_Battery”’, and get all batteries

I’ve never seen a way to add multiple items at once, but maybe you should ask in the Grafana forum as they would likely have better info? https://community.grafana.com/

You can set up variables to achieve this: In your dashboard go to “Dashboard Settings” (the gear wheel in the upper right), then select “Variables”. Here you can create a variable (let’s name it AllBatteries) of type Query, the query is show series. Give a regular expression to select all the items you want, e.g. (.*_Battery).

Back in the dashboard, in the Query editor where you could previously only choose a single item, enter the text /$AllBatteries/. That should do what you want.

Sorry, I don’t remeber more details, I did this a few years back. Hope this helps. I can add some screenshots, if required.

Edit: This seems to be done differently in Influxdb v2. This might be helpful: Grafana + InfluxDB Flux - query for displaying multi-select variable inputs - #13 by pgg - InfluxDB - Grafana Labs Community Forums

Okay, now you’ve done it: You made me migrate my old Grafana chart to my OH3 instance (which was recreated from scratch) and Influxdb2 (and also upgrade Grafana from v5 to v8).

Since Influxdb2 uses “Flux” as query language, it works quite differently from what I described above for InfluxDB versions <1.8. Since I won’t remember how to do it in a few weeks, I decided to write it down for myself and others :slight_smile:

How to create a chart in Grafana with multiple items automatically fetched from Openhab by name:

My example uses a “State timeline” type chart to display the Online state (0/1) of some Wifi Devices, using the persisted state of some Openhab switch items. The items are identified through a naming scheme: All item names have the suffix “_DeviceState” (e.g. Wifiplug01_DeviceSatate, Wifilight04_DeviceState, …).

We will let Grafana find the items automatically using the common suffix. If an item with the same suffix is added in Openhab it will automatically be picked up by Grafana.

  1. Create a new Dashboard in Grafana
  2. Click the “Gears” icon top right to “open dashboard settings”
  3. Click “Variables” and “Add” to add a new variable
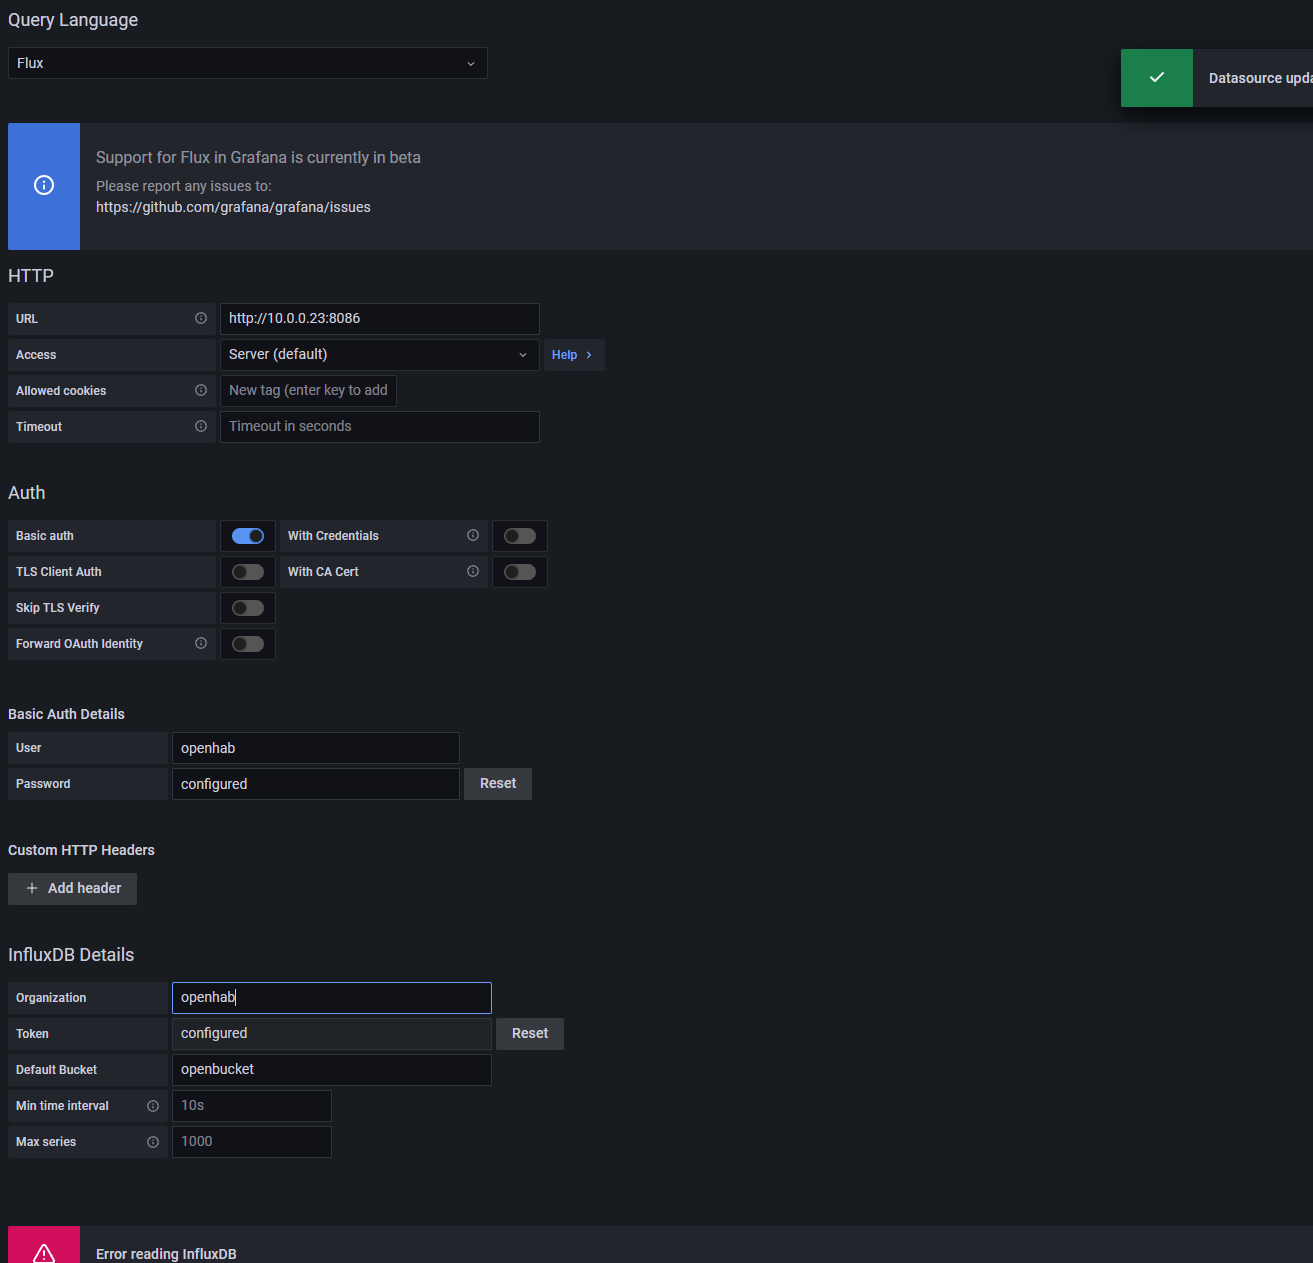
  4. Fill out the form like shown in the screenshot. Replace “Name” and “Label” with whatever suits you.
    Use the bucket name for your influx database instead of “openhab”.
  5. The “Regex” field is where you select your Openhab items. Here, it is a regular expression (indicated by the ‘/’ an beginning and end) to select all words ending in “_DeviceStatus”.
    At the bottom of the screen you will see the result as a preview if you click outside the field you are editing. (Here: EspGarageDoor_DeviceStatus, …)
  6. Click “Save” or “Update” once the preview shows the desired result.
  7. Go back to the dashboard and add a new panel. I used the type chart type “State timeline”, but "Time series should work, as well.
  8. Edit the chart panel (click the down arrow to the right of the panel title). Here you need to enter the query which retrieves the data from Influxdb. The query (in Flux language syntax) needs to look like this:
from(bucket: "openhab")
  |> range(start: v.timeRangeStart, stop:v.timeRangeStop)
  |> filter(fn: (r) => r._measurement =~ /^${AllDeviceStates:regex}$/ and
     r._field == "value"
  )

replace “openhab” with your Influxdb bucket name and “AllDeviceStates” with your variable name.
The 3. line is where the query differs from what Grafana has as a template: instead of == we use =~, instead of putting the search string in quotes we put it between slashes, to indicate it is a regular expression. Finally, the variable name is appended with :regex to tell Grafana that it shall “interpret” this variable as a regular expression, not as a list of words. (Note: The leading caret ^ and trailing $ are only there to make sure we compare complete words and not substrings. Usually not necessary, but for completeness’ sake…)

  1. The preview of the graph should already show your items. To make it look a bit nicer, we can now adjust some settings in the right-hand panel as shown in the next two screenshots. Note that some of this is specific to the “State timeline”, but here we can “play around” with the settings and just see what happens.

    Of particular interest is the field “Display name”. This is what is displayed in the legend of the graph. We want to show the Openhab label for each item here.
    Only needed if you want to show switches in a “State timeline” (as in this example) are the fields “Color scheme” and “Value mappings”. We need to set both as shown here to tell Grafana which color should be drawn for “ON” (1) and “OFF” (0) states.

The result looks like this:
grafik

The nice thing about this technique is that Grafana shows a popup menu where we can select which of the items we want to show. And if we add an item to Openhab it will automatically appear in Grafana.

Final note: If we don’t want the popup menu for selecting the items and instead want Grafana to always show all items, we can simply omit steps 2-7 and instead use a qurey string like this:

 from(bucket: "openhab")
  |> range(start: v.timeRangeStart, stop:v.timeRangeStop)
  |> filter(fn: (r) => r._measurement =~ /.*_DeviceStatus/ and
     r._field == "value"
  )

Instead of giving the variable name between the slashes we can enter a regular expression directly. If a selection menu is not required, this makes everything quite a bit simpler.

Hope this helps somebody. Particularly this application of showing several (many) Openhab items in one chart, generated automatically, is something I believe the built-in charts of Openhab ManuUI cannot (yet) do. Grafana doesn’t make it simple (IMHO), but at least it makes it possible.

Jens

2 Likes

This is so cool. Exactly what I’m looking for!

However I’m stuck before I have even started.

My primary Pi (standard openhabian SD install) is operational and setup with InfluxDB1 and writting to an SSD to reduce wear on SD card.
I’d rather not mess with this until I understand all of this a bit more.
And I’m also starting to explore Docker (working on my Windows PC) as a way to test, and maybe deploy openhab systems. I’m trying to create a Docker Compose of: OpenHAB, Loki, Promtail, Grafana, and any other system critical programms that need to interact. Nearly there - OpenHab, Loki, Promtail, and Grafana are working nicely, but I’m stuggling to get this final step of InfluxDB working (V1 or V2)
image
docker-compose.yml

version: '3'

services:
  openhab:
    image: "openhab/openhab:milestone"
    restart: always
    ports:
      - "8080:8080"
      - "8443:8443"
    volumes:
      - ./openhab/addons:/openhab/addons
      - ./openhab/conf:/openhab/conf
      - ./openhab/userdata:/openhab/userdata
    environment:
      OPENHAB_HTTP_PORT: "8080"
      OPENHAB_HTTPS_PORT: "8443"
      EXTRA_JAVA_OPTS: "-Duser.timezone=Europe/Dublin"

  loki:
    image: grafana/loki
    ports:
      - "3100:3100"
    volumes:
      - ./loki/mnt/config:/mnt/config
    command: -config.file=/mnt/config/loki-local-config.yaml
    

  promtail:
    image: grafana/promtail
    volumes:
      - ./promtail/var/lib/docker/containers:/var/lib/docker/containers
      - ./promtail/etc/promtail:/etc/promtail
      - ./:/logs
    command: -config.file=/etc/promtail/promtail-local-config.yaml
    

  grafana:
    image: grafana/grafana
    ports:
      - "3000:3000"
    volumes:
      - ./grafana/etc/grafana:/etc/grafana
      - ./grafana/var/lib/grafana:/var/lib/grafana  
      - ./grafana/var/log/grafana:/var/log/grafana
      - ./grafana/var/lib/grafana/plugins:/var/lib/grafana/plugins
      - ./grafana/etc/grafana/provisioning:/etc/grafana/provisioning  


Folder stucture of mounted volumes with configuration files for Docker containers on my PC

Can you explain simply what I need to do to get both slightly different systems working with InfluxDB V2?
Trying to follow any instructions on the web is really difficult.

I installed InfluxDB from the OpenHAB bindings page. I have filled out all the obvious fields in both OpenHAB persistence settings and Grafana datasource settings page, I created a Grafana API token, but still not getting any joy.


ignore this. I figured it out. I’ll try to write it up later.