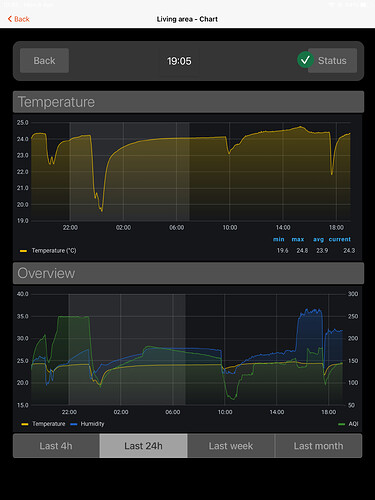
Grafana chart with time ranges

With great support by @BobMiles, @RGroll and @ysc I managed to create a widget to embed grafana charts with configurable time ranges.

If interested, you can find the whole discussion here.

Grafana chart widget

Grafana widget props

Source URL:
Make sure you insert {period} inside the URL where you would want to have the time range pasted.

Example:

http://192.168.0.13:3000/d-solo/4OdYJNbMk/energie-pv-haus?orgId=1&refresh=1m&from=now-{period}&to=now&panelId=2

Resources

Full widget YAML (updated 2021-04-05: segmented “strong” removed):

uid: Grafana chart with timeranges
tags: []
props:
  parameters:
    - description: Title of the chart
      label: Title
      name: title
      required: false
      type: TEXT
    - description: Footer of the chart
      label: Footer
      name: footer
      required: false
      type: TEXT
    - description: URL to show in the frame
      label: Source URL
      name: URL
      required: true
      type: TEXT
    - description: Comma-separated list of options. Use value=label format (e.g. 1d=1 day) to provide a label different than the option. Minimum 1 entry required. The first entry is the default timerange.
      label: Time range options
      name: timerange
      required: true
      type: TEXT
    - description: Height of the Frame (empty = default)
      label: Height
      name: height
      required: false
      type: TEXT
  parameterGroups: []
timestamp: Mar 21, 2021, 5:17:50 PM
component: f7-card-content
config:
  style:
    --f7-card-margin-horizontal: 0px
    --f7-card-margin-vertical: 3px
    --f7-card-content-padding-horizontal: 10px
    --f7-card-content-padding-vertical: 10px
slots:
  default:
    - component: oh-webframe-card
      config:
        title: =props.title
        borders: false
        noBorder: false
        outline: true
        height: =props.height
        src: =props.URL.replace('{period}', vars.selectedPeriod || [props.timerange.split(',')[0].split('=')[0]])
        footer: =props.footer
        class:
          - display-block
    - component: f7-segmented
      config:
        round: false
        outline: false
        style:
          --f7-button-bg-color: rgba(255, 255, 255, 0.05)
      slots:
        default:
          - component: oh-repeater
            config:
              sourceType: range
              for: size
              fragment: true
            slots:
              default:
                - component: oh-repeater
                  config:
                    fragment: true
                    for: period
                    in: =[props.timerange.split(",")[loop.size].split("=")[1]]
                  slots:
                    default:
                      - component: oh-button
                        config:
                          text: =loop.period
                          fill: "=(([props.timerange.split(',')[loop.size].split('=')[0]] == vars.selectedPeriod) || (props.timerange.split(',')[0].split('=')[1] === loop.period) && !vars.selectedPeriod) ? true : false"
                          round: false
                          outline: true
                          style:
                            --f7-button-font-size: 14px
                            --f7-button-font-weight: 300
                            --f7-button-text-transform: none
                            --f7-button-border-width: 1px
                            --f7-button-text-color: white
                            --f7-button-border-color: rgba(255,255,255,.15)
                            --f7-button-padding-vertical: 0px
                            --f7-button-padding-horizontal: 0px
                            --f7-button-fill-hover-bg-color: rgba(var(--f7-theme-color-rgb), 1)
                          action: variable
                          actionVariable: selectedPeriod
                          actionVariableValue: =props.timerange.split(",")[loop.size].split("=")[0]

New version with more flexible implementation of time ranges:

Changelog:
v02: added default timeranges in props

uid: Grafana chart with timeranges v02
tags: []
props:
  parameters:
    - description: Title of the chart
      label: Title
      name: title
      required: false
      type: TEXT
    - description: URL to show in the frame
      label: Source URL
      name: URL
      required: true
      type: TEXT
    - default: from=now-6h&to=now;6h,from=now-12h&to=now;12h,from=now-1d&to=now;24h,from=now/d&to=now/d;Day,from=now-3d&to=now;Last 3 Days,from=now-7d&to=now;Last 7 Days,from=now-14d&to=now;Last 14 Days
      description: Comma-separated List of options. Example "from=now-6h&to=now;-6h,from=now-1d/d&to=now-1d/d;yesterday" for past "6h" and "yesterday". First entry is default.
      label: Time range options
      name: timerange
      required: true
      type: TEXT
    - description: Height of the Frame (empty = default)
      label: Height
      name: height
      required: false
      type: TEXT
  parameterGroups: []
timestamp: Apr 23, 2021, 4:40:01 PM
component: f7-card
config:
  title: =props.title
  outline: true
  style:
    --f7-card-margin-horizontal: 10px
    --f7-card-margin-vertical: 3px
    --f7-card-padding-horizontal: 10px
    --f7-card-padding-vertical: 100px
    margin-top: 10px
    margin-bottom: 10px
    noShadow: false
    border-radius: var(--f7-card-expandable-border-radius)
    box-shadow: 5px 5px 10px 1px rgba(0,0,0,0.3)
slots:
  default:
    - component: oh-webframe-card
      config:
        borders: false
        noBorder: false
        noShadow: true
        height: =props.height
        src: =props.URL.replace('{period}', vars.selectedPeriod || [props.timerange.split(',')[0].split(';')[0]])
        class:
          - display-block
    - component: f7-segmented
      config:
        round: false
        outline: false
        class:
          - padding-bottom-half
        style:
          margin-left: 10px
          margin-right: 10px
          --f7-button-font-size: 14px
          --f7-button-text-color: "=themeOptions.dark === 'light' ? 'black' : 'white'"
          --f7-button-text-transform: none
          --f7-button-border-radius: 4px
          --f7-button-outline-border-width: 1px
          --f7-button-font-weight: 300
          --f7-button-padding-vertical: 0px
          --f7-button-padding-horizontal: 0px
      slots:
        default:
          - component: oh-repeater
            config:
              sourceType: range
              for: size
              fragment: true
            slots:
              default:
                - component: oh-repeater
                  config:
                    fragment: true
                    for: period
                    in: =[props.timerange.split(",")[loop.size].split(";")[1]]
                  slots:
                    default:
                      - component: oh-button
                        config:
                          text: =loop.period
                          fill: "=(([props.timerange.split(',')[loop.size].split(';')[0]] == vars.selectedPeriod) || (props.timerange.split(',')[0].split(';')[1] === loop.period) && !vars.selectedPeriod) ? true : false"
                          round: false
                          outline: true
                          style:
                            --f7-button-border-color: var(--f7-card-outline-border-color)
                          action: variable
                          actionVariable: selectedPeriod
                          actionVariableValue: =props.timerange.split(",")[loop.size].split(";")[0]

This one requires adjustment in the widget props as follows:

config:
  URL: http://192.168.0.13:3000/d-solo/4OdYJNbMk/energie-pv-haus?orgId=1&refresh=1m&theme=light&{period}&panelId=2
  timerange: from=now-6h&to=now;6h,from=now-12h&to=now;12h,from=now-1d&to=now;24h,from=now/d&to=now/d;Tag,from=now-1d/d&to=now-1d/d;Tag-1,from=now-2d/d&to=now-2d/d;Tag-2

Hope some of you find it useful :slightly_smiling_face:

26 Likes

Hello Marcus
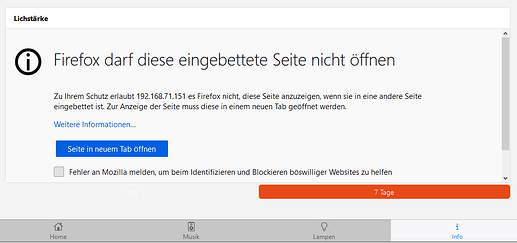
First of all, thank you for this nite idea and I would love to integrate this feature in my UI. But it seems that I have trouble to access the given URL:

If I click the button then Grafana opens in a new window with the correct time range. Did you have a similar problem?

In the mobile version (iOS) I don’t even get the browser warning and everything keeps empty . Any idea?

Best regards
-Prom

It works for me on Win10/Chrome, iOS for iPad and iOS for iPhone.
It behaves exactly as shown in the first post of this thread.

I’m sorry, but I cannot help you.

I tried Chrome as well but with no luck. May I ask you for your setup?
I’m running both OH3 and Grafana&InfluxDB on the same Raspberry Pi 4 (installed via openHABian). My UI-clients are actually all mobiles (iPhones) and iPads in my family. Using Firefox and Chrome is only for configuring and testing.
I used exactly your YAML from the first posting.

I played around a little and I figured if I replace in your YAML in line 42:

src: =props.URL.replace('{period}', vars.selectedPeriod || [props.timerange.split(',')[0].split('=')[0]])

with:
src: http://leo.org

and it works. Meaning I see the Leo-page in the webframe. But if I try:
src: http://google.com or src: http://google.de

I get the same error message than above. Can someone explain this to me please!

well, try this… if not done already…

Adapt grafana.ini

[security]
# set to true if you want to allow browsers to render Grafana in a <frame>, <iframe>, <embed> or <object>. default is false.
allow_embedding = true

You propobly not talking about the grafana.ini in here?

openhabian@openhabian:/etc/grafana $ ls -l
-rw-r----- 1 root grafana 33282 Feb 10 19:02 grafana.ini

because such an entry is not inside. But I think I’m facing here a different problem because even in a standard oh-webframe-card my URL won’t show up. I will start a new topic but thank you for your widget anyway :slight_smile:

Yes, this is the file I’m talking about - and I’m pretty sure this is the solution to your problem.

I need to stress that I’m not on a openhabian deployment. I did a manual install of openHAB3, Grafana and InfluxDB.

The file grafana.ini has a section “Security” starting in line 175 (this may vary a bit depending on how many lines you added above).

same here

You saved my day!!! Thank you, your are right, this parameter did the trick. Maybe I was blessed with blindness when I check the Ini-file yesterday :see_no_evil:

Hello Marcus,

…wow, that was EXACTLY what I was searching for! Thank you (and the supprt as well) so much! Great, it worked instantly! And the best part of it: I learned a couple of things, which I didn´t understand until now :slight_smile:

Just a minimal addition: I added props for the height of the frame, cause some of my dashboards are … lets say “very rich” and therefore very tall.

So cheers and thank you for sharing!

Glad you find it useful.

Well, I learned a lot myself from the very kind community here.

May I kindly ask you to share your YAML - I’m planning to make a few small updates to the code in the first post anyway, so why not add your enhancements as well :slightly_smiling_face:

Sure! Here you go - just a minimal addition:


-uid: Grafana chart with timeranges
tags: []
props:
  parameters:

    - description: Height of the Frame
      label: Height
      name: height
      required: true
      type: TEXT

...

slots:
  default:
    - component: oh-webframe-card
      config: 
...
        
        height: =props.height

…or the whole thing:


uid: Grafana chart with timeranges
tags: []
props:
  parameters:
    - description: Title of the chart
      label: Title
      name: title
      required: false
      type: TEXT
    - description: Footer of the chart
      label: Footer
      name: footer
      required: false
      type: TEXT
    - description: URL to show in the frame
      label: Source URL
      name: URL
      required: true
      type: TEXT
    - description: Comma-separated list of options. Use value=label format (e.g. 1d=1 day) to provide a label different than the option. Minimum 1 entry required. The first entry is the default timerange.
      label: Time range options
      name: timerange
      required: true
      type: TEXT
    - description: Height of the Frame
      label: Height
      name: height
      required: true
      type: TEXT
  parameterGroups: []
timestamp: Feb 20, 2021, 10:28:57 PM
component: f7-card-content
config:
  style:
    --f7-card-margin-horizontal: 0px
    --f7-card-margin-vertical: 3px
    --f7-card-content-padding-horizontal: 10px
    --f7-card-content-padding-vertical: 10px
slots:
  default:
    - component: oh-webframe-card
      config:
        title: =props.title
        borders: false
        noBorder: false
        outline: true
        src: =props.URL.replace('{period}', vars.selectedPeriod || [props.timerange.split(',')[0].split('=')[0]])
        footer: =props.footer
        height: =props.height
        class:
          - display-block
    - component: f7-segmented
      config:
        round: false
        outline: false
        class:
          - segmented-strong
        style:
          --f7-segmented-strong-padding: 0px
          --f7-segmented-strong-between-buttons: 5px
          --f7-segmented-strong-button-font-weight: 300
          --f7-segmented-strong-bg-color: rgba(255, 255, 255, 0.05)
          --f7-segmented-strong-button-hover-bg-color: rgba(255, 255, 255, 0.07)
      slots:![image|620x500](upload://3OrN1UdDsF5brsM96bzhMkQPj6s.png) 
        default:
          - component: oh-repeater
            config:
              sourceType: range
              for: size
              fragment: true
            slots:
              default:
                - component: oh-repeater
                  config:
                    fragment: true
                    for: period
                    in: =[props.timerange.split(",")[loop.size].split("=")[1]]
                  slots:
                    default:
                      - component: oh-button
                        config:
                          text: =loop.period
                          fill: "=(([props.timerange.split(',')[loop.size].split('=')[0]] == vars.selectedPeriod) || (props.timerange.split(',')[0].split('=')[1] === loop.period) && !vars.selectedPeriod) ? true : false"
                          round: false
                          outline: false
                          style:
                            --f7-button-font-size: 12px
                            --f7-button-font-weight: 300
                            --f7-button-border-width: 1px
                            --f7-button-text-color: rgb(255, 255, 255)
                            --f7-button-border-color: rgba(255,255,255,.15)
                            --f7-button-border-radius: 5px
                          action: variable
                          actionVariable: selectedPeriod
                          actionVariableValue: =props.timerange.split(",")[loop.size].split("=")[0]

Thats it :slight_smile:

Hi Marcus,

Thanks a lot for sharing this widget, works great! I’m a beginner at the CSS stuff but with help from various examples in the forum I was able to put together a user interface for my iPad and I adapted your widget for this as well:


The only problem I’m having now is the orange ‘Active’ color for the segmented buttons doesn’t really fit with the rest of the interface… :smiley:

After using the developer tools in the browser I think the orange is the ‘Template color’ but I can’t figure out how to change it. I want to see if I can use the segmented button in more places in the interface but then I need to be able to change the active color.

I tried using
--f7-segmented-strong-button-active-bg-color: "#A1A1A1"
but that doesn’t seem to work.

Do you have any idea how to change the active color for the segmented buttons?

I’m not a CSS expert either - mostly using the default theme colors.
I will try a few things - let’s see…

@ysc once copied me the following which I found to be very useful…

try:

--f7-button-fill-bg-color: blue

BTW I decided not to use segmented “strong” any longer - I just updated the YAML in the first post.

Thanks for the link to the OH color themes stuff. I obviously need to spend a lot more time on this… I did find the Framework7 button documentation but didn’t connect the dots to use the button-fill color instead of the active color

–f7-button-fill-bg-color: “#A1A1A1
–f7-button-fill-text-color: ‘#353535

did the trick, it’s working now! :partying_face: :smiley: The ‘regular’ segmented looks much nicer, using that too now:

Thanks for the help and again for sharing the widget itself, really like the convenient integration with Grafana.

1 Like

many thanks for sharing this widget.
I am using it to include my solar forecast in grafana into the OH3 ui

component: widget:Grafana chart with timeranges
config:
timerange: 1d=1 day,3d=3 day,7d=7 day
height: “400”
URL: http://192.168.1.210:3000/d-solo/mgJqv2lGz/solar?orgId=1&now-{period}&to=now%2B56h&theme=dark&panelId=6

unfortunately the switching of the time range does not change the time range in the iframe. If i do a web inspection in firefox the period is actually replaced by the selected time range but the view does not update.
"http://192.168.1.210:3000/d-solo/mgJqv2lGz/solar?orgId=1&amp;now-7d&amp;to=now%2B56h&amp;theme=dark&amp;panelId=6

any hint what could be the root course of it

Have you done the changes in grafana.ini ?

yes, the grafana.ini is already configured.
allow_embedding is already set to true
The panel can be integrated into the OH3 UI

it is just the switching of the time range that does not work.

component: widget:Grafana chart with timeranges
config:
  timerange: 1d=1 day,3d=3 day,7d=7 day
  height: “400”
  URL: http://192.168.1.210:3000/d-solo/mgJqv2lGz/solar?orgId=1&now-{period}&to=now%2B56h&theme=dark&panelId=6

Make sure you have the correct line-up for the parameters within “config”. They should not be on the same level.