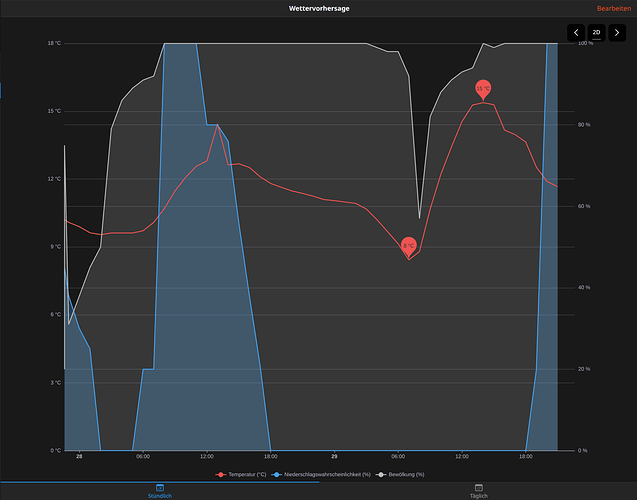
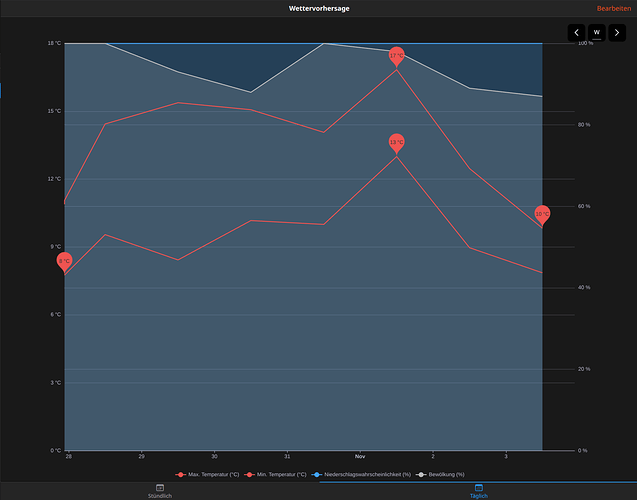
This tutorial is targeting openHAB 4.2 and newer. Whilst most things described here already work with openHAB 4.1, not everything here works at all or in the described way — please use openHAB 4.2 or newer!
openHAB 4.1 introduced support for sending time series to Items and persisting future states, which is especially useful for any type of forecast.
The OpenWeatherMap binding was one of the first bindings to support this new feature, and with openHAB 4.2 Main UI charts will be able to display future data:
This post will guide you through all required steps to get your own weather forecast charts.
Thing
First of all, you need to add the OpenWeatherMap OneCall Thing:
- Install the OpenWeatherMap binding.
- Add the OpenWeatherMap Account Thing. (You need an OpenWeatherMap account and setup payment details for the OneCall 3.0 API, but you can set a daily API call limit so you never have to pay. See OpenWeatherMap - Bindings | openHAB)
- If you have set your home location, the OneCall Weather and Forecast Thing will be added to the Thing Inbox.
- Accept it, and don‘t change the Thing UID.
Items
Add the following Items (either by using an .items file or in the UI: Developer Tools → Add Items from Textual Definition):
Required Items
Group                 gOWM_TimeSeries
// Hourly
Number:Temperature    OneCall_Forecast_Hourly_Temperature                             "Temperatur [%.1f °C]"                     <temperature>  (gOWM_TimeSeries)  {channel="openweathermap:onecall:bridge:local:forecastHourly#temperature"}
Number:Dimensionless  OneCall_Forecast_Hourly_Cloudiness                              "Bewölkung [%d %%]"                        <sun_clouds>   (gOWM_TimeSeries)  {channel="openweathermap:onecall:bridge:local:forecastHourly#cloudiness", unit="%"}
Number:Dimensionless  OneCall_Forecast_Hourly_PrecipitationProbability                "Niederschlagswahrscheinlichkeit [%d %%]"  <rain>         (gOWM_TimeSeries)  {channel="openweathermap:onecall:bridge:local:forecastHourly#precip-probability", unit="%"}
// Daily
Number:Temperature    OneCall_Forecast_Daily_MinTemperature                           "Min. Temperatur [%.1f °C]"                <temperature>  (gOWM_TimeSeries)  {channel="openweathermap:onecall:bridge:local:forecastDaily#min-temperature"}
Number:Temperature    OneCall_Forecast_Daily_MaxTemperature                           "Max. Temperatur [%.1f °C]"                <temperature>  (gOWM_TimeSeries)  {channel="openweathermap:onecall:bridge:local:forecastDaily#max-temperature"}
Number:Dimensionless  OneCall_Forecast_Daily_Cloudiness                               "Bewölkung [%d %%]"                        <sun_clouds>   (gOWM_TimeSeries)  {channel="openweathermap:onecall:bridge:local:forecastDaily#cloudiness", unit="%"}
Number:Dimensionless  OneCall_Forecast_Daily_PrecipitationProbability                 "Niederschlagswahrscheinlichkeit [%d %%]"  <rain>         (gOWM_TimeSeries)  {channel="openweathermap:onecall:bridge:local:forecastDaily#precip-probability", unit="%"}
Persistence
In theory you can use any persistence service with support for time series (e.g. InfluxDB, JDBC — RRD4J works not), but we will use the InMemory persistence service because of its simplicity.
- Install the InMemory Persistence add-on.
- Go to Settings → Persistence → Configure Persistence Policies: In Memory.
- Add a configuration: Select the
gOWM_TimeSeriesgroup and theforecaststrategy.
Charts
Now you are finally ready to add the UI pages containing the charts:
Create a new chart page and set its Page ID to weather_forecast_hourly. Copy the following code to the code tab:
weather_forecast_hourly chart page code
config:
  future: true
  icon: f7:cloud_sun_rain_fill
  label: Wettervorhersage
  period: 2D
slots:
  dataZoom:
    - component: oh-chart-datazoom
      config:
        type: inside
  grid:
    - component: oh-chart-grid
      config:
        includeLabels: true
  legend:
    - component: oh-chart-legend
      config:
        bottom: 3
        type: scroll
  series:
    - component: oh-time-series
      config:
        color: "#ef5350"
        gridIndex: 0
        item: OneCall_Forecast_Hourly_Temperature
        markPoint:
          data:
            - name: min
              type: min
            - name: max
              type: max
          label:
            backgroundColor: auto
            formatter: =(params) => Number.parseFloat(params.value).toFixed(0) + ' °C'
          symbol: pin
          symbolSize: 60
        name: Temperatur (°C)
        service: inmemory
        type: line
        xAxisIndex: 0
        yAxisIndex: 0
    - component: oh-time-series
      config:
        areaStyle:
          opacity: 0.3
        color: "#42a5f5"
        gridIndex: 0
        item: OneCall_Forecast_Hourly_PrecipitationProbability
        name: Niederschlagswahrscheinlichkeit (%)
        service: inmemory
        type: line
        xAxisIndex: 0
        yAxisIndex: 1
    - component: oh-time-series
      config:
        areaStyle:
          opacity: 0.2
        color: "#bdbdbd"
        gridIndex: 0
        item: OneCall_Forecast_Hourly_Cloudiness
        name: Bewölkung (%)
        service: inmemory
        type: line
        xAxisIndex: 0
        yAxisIndex: 1
  tooltip:
    - component: oh-chart-tooltip
      config:
        confine: true
        snap: true
        valueFormatter: =(value) => value.replace(',', '').replace('.', ',')
  xAxis:
    - component: oh-time-axis
      config:
        gridIndex: 0
  yAxis:
    - component: oh-value-axis
      config:
        axisLabel:
          formatter: "{value} °C"
        gridIndex: 0
    - component: oh-value-axis
      config:
        axisLabel:
          formatter: "{value} %"
        gridIndex: 0
        max: "100"
        min: "0"
Create a new chart page and set its Page ID to weather_forecast_daily. Copy the following code to the code tab:
weather_forecast_daily chart page code
config:
  future: true
  icon: f7:cloud_sun_rain_fill
  label: Wettervorhersage
  period: W
slots:
  dataZoom:
    - component: oh-chart-datazoom
      config:
        type: inside
  grid:
    - component: oh-chart-grid
      config:
        includeLabels: true
  legend:
    - component: oh-chart-legend
      config:
        bottom: 3
        type: scroll
  series:
    - component: oh-time-series
      config:
        color: "#ef5350"
        gridIndex: 0
        item: OneCall_Forecast_Daily_MaxTemperature
        markPoint:
          data:
            - name: min
              type: min
            - name: max
              type: max
          label:
            backgroundColor: auto
            formatter: =(params) => Number.parseFloat(params.value).toFixed(0) + ' °C'
          symbol: pin
          symbolSize: 60
        name: Max. Temperatur (°C)
        service: inmemory
        type: line
        xAxisIndex: 0
        yAxisIndex: 0
    - component: oh-time-series
      config:
        color: "#ef5350"
        gridIndex: 0
        item: OneCall_Forecast_Daily_MinTemperature
        markPoint:
          data:
            - name: min
              type: min
            - name: max
              type: max
          label:
            backgroundColor: auto
            formatter: =(params) => Number.parseFloat(params.value).toFixed(0) + ' °C'
          symbol: pin
          symbolSize: 60
        name: Min. Temperatur (°C)
        service: inmemory
        type: line
        xAxisIndex: 0
        yAxisIndex: 0
    - component: oh-time-series
      config:
        areaStyle:
          opacity: 0.3
        color: "#42a5f5"
        gridIndex: 0
        item: OneCall_Forecast_Daily_PrecipitationProbability
        name: Niederschlagswahrscheinlichkeit (%)
        service: inmemory
        type: line
        xAxisIndex: 0
        yAxisIndex: 1
    - component: oh-time-series
      config:
        areaStyle:
          opacity: 0.2
        color: "#bdbdbd"
        gridIndex: 0
        item: OneCall_Forecast_Daily_Cloudiness
        name: Bewölkung (%)
        service: inmemory
        type: line
        xAxisIndex: 0
        yAxisIndex: 1
  tooltip:
    - component: oh-chart-tooltip
      config:
        confine: true
        snap: true
        valueFormatter: =(value) => value.replace(',', '').replace('.', ',')
  xAxis:
    - component: oh-time-axis
      config:
        gridIndex: 0
  yAxis:
    - component: oh-value-axis
      config:
        axisLabel:
          formatter: "{value} °C"
        gridIndex: 0
    - component: oh-value-axis
      config:
        axisLabel:
          formatter: "{value} %"
        gridIndex: 0
        max: "100"
        min: "0"
Create a new tabbed page.
Copy the following code to the code tab:
Tabbed page code
config:
  icon: f7:cloud_sun_rain_fill
  label: Wettervorhersage
tabs:
  - component: oh-tab
    config:
      icon: f7:calendar_today
      page: page:weather_forecast_hourly
      title: Stündlich
    slots:
      default: []
  - component: oh-tab
    config:
      icon: f7:calendar
      page: page:weather_forecast_daily
      title: Täglich
    slots:
      default: []
Feel free to modify all labels to match your language.
In case your country used . as decimal point (in Germany we use ,), just remove valueFormatter from the oh-chart-tooltip component of the chart pages.


