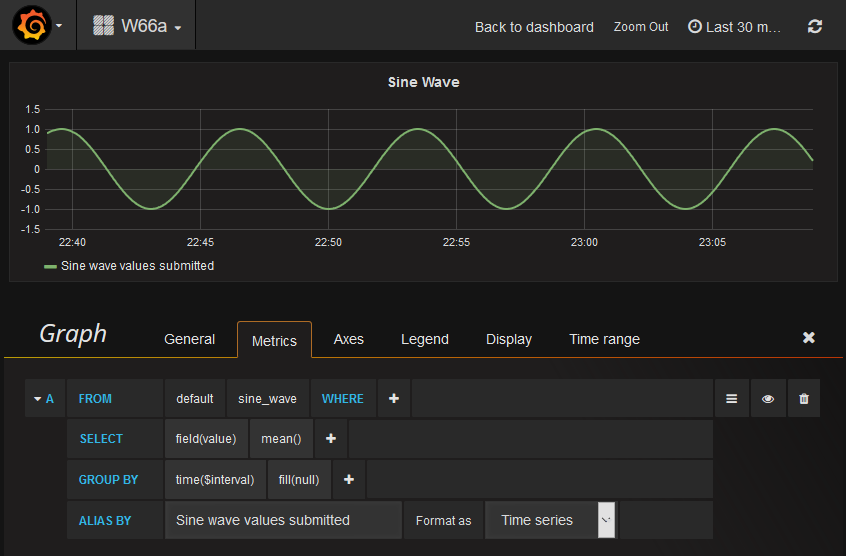
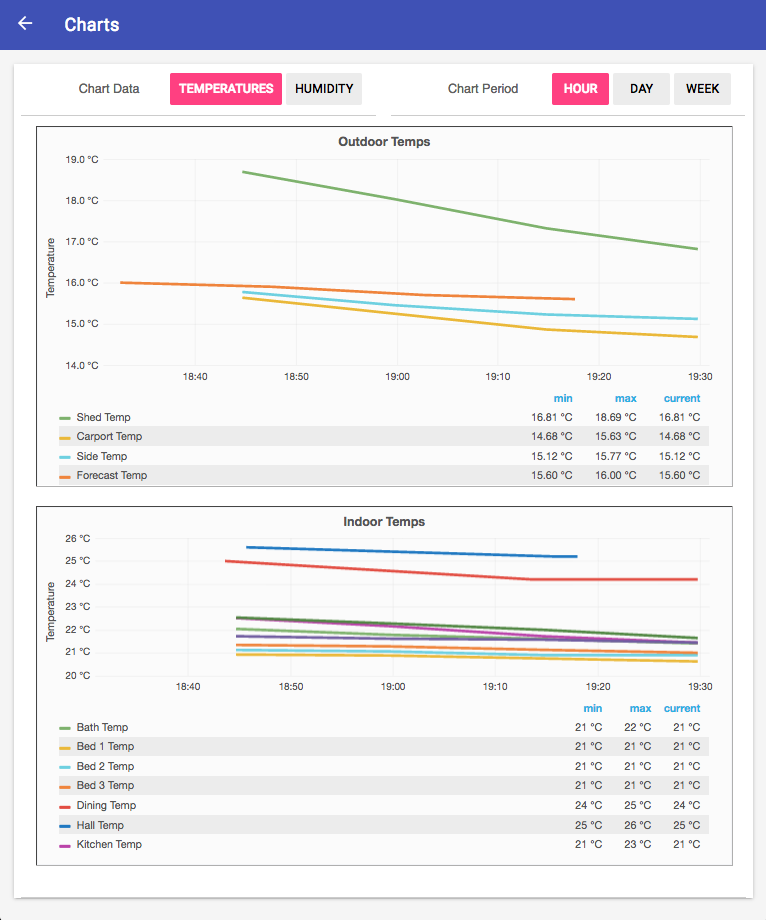
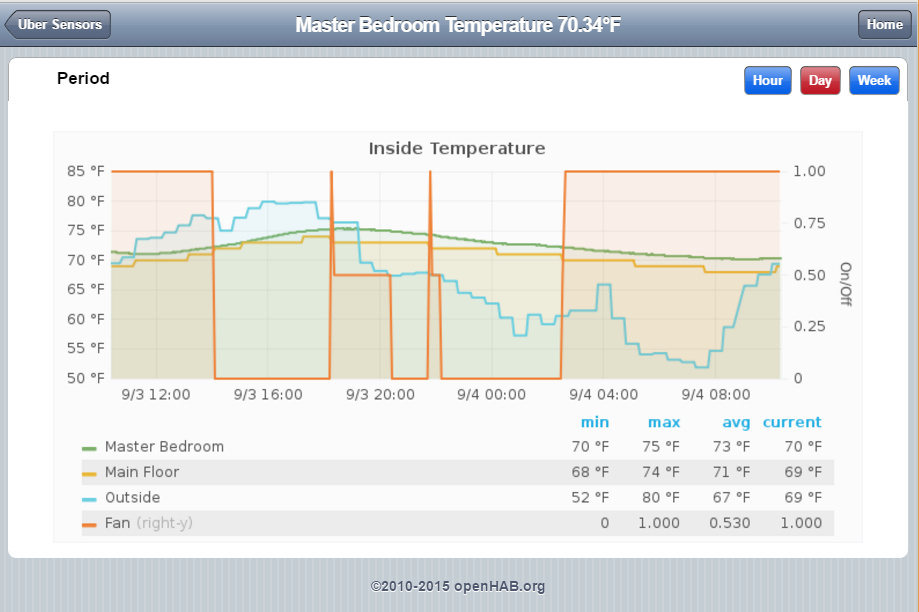
Store your openHAB item states in an InfluxDB time-series datastore and create highly customizable diagrams with Grafana. These diagrams can in return be included in your sitemap as images.
Following this guide, you will install InfluxDB and Grafana, make openHAB store data in an InfluxDB database, make Grafana fetch data from the InfluxDB database and draw diagrams. Finally you can include these diagrams in your openHAB sitemap.
Table of Content
- Starting Point
- InfluxDB Installation and Setup
- Grafana Installation and Setup
- Connecting Grafana to InfluxDB
- Connecting openHAB to InfluxDB
- Building openHAB Diagrams in Grafana
- Showing diagrams in your openHAB sitemap
- Persistance Data Migration
- Examples
Starting Point
This guide is based on and was last tested with the following components:
- openHAB 2.0
- InfluxDB persistence service (persistence-influxdb-1.9.0.SNAPSHOT)
- On the same system or on a system in the same network
Installation on a Raspberry Pi is also possible, installation instructions are given here.
Installation inside a docker image is described here.
Attention rrd4j users: A script to transfer your existing data from rrd4j to InfluxDB (by @Dangar) can be found here: GitHub - jhron/rrd2influxdb: Tool for converting Openhab rrd4j data file to InfluxDB line protocol file.
InfluxDB Installation and Setup
Following the installation instructions, start by adding the InfluxData repository and installing InfluxDB on your monitoring-host.
After successful installation, let’s connect to the InfluxDB command line interface and create users and databases for our needs. You may alternatively also use the web frontend to do so, the steps are nearly the same. We will create one database for your openHAB installation and an admin, an openhab and a grafana user. The user openhab will only receive privileges for his database, the grafana user will only be allowed to read. Be sure to store your selected passwords.
You may skip the extra security steps for Authentication and Authorization, depending on the reachability of your monitoring-host. In this case, you only need to create the database.
$ influx
Connected to http://localhost:8086 version 0.13
InfluxDB shell version: 0.13
> CREATE DATABASE openhab_db
> CREATE USER admin WITH PASSWORD 'SuperSecretPassword123+' WITH ALL PRIVILEGES
> CREATE USER openhab WITH PASSWORD 'AnotherSuperbPassword456-'
> CREATE USER grafana WITH PASSWORD 'PleaseLetMeRead789?'
> GRANT ALL ON openhab_db TO openhab
> GRANT READ ON openhab_db TO grafana
> exit
Additional CLI commands can be found in the InfluxDB documentation.
Enable authentication in the [http] section of the configuration file /etc/influxdb/influxdb.conf:
[http]
enabled = true
bind-address = ":8086"      # change to a specific interface if needed
auth-enabled = true         # will enforce authentication
...
Finally, restart the InfluxDB service: sudo systemctl restart influxdb.service.
The CLI interface will now also ask for authentication:
influx -username admin -password SuperSecretPassword123+ -host localhost
If you ran into any problems, please refer to the InfluxDB documentation and use google to find more in-detail tutorials.
This is a good time to start injecting data into your InfluxDB for later testing with Grafana. I’ve provided a small Python script here. If you are not familiar with Python, please have a look at a short tutorial, e.g. this one. Configure and execute the script on your openHAB host to get a sine wave data series stored in the database.
Grafana Installation and Setup
Follow the installation instructions, to install Grafana on your monitoring-host.
After successful installation you should be able to reach the Grafana dashboard at http://monitoring-host:3000 with the default login admin:admin - be sure to change the password now!
Disable user signup and enable anonymous access (for later image export) in the configuration file /etc/grafana/grafana.ini:
[users]
# disable user signup / registration
allow_sign_up = false
...
[auth.anonymous]
# enable anonymous access
enabled = true
If you ran into any problems, please refer to the Grafana documentation and use google to find more in-detail tutorials.
Connecting Grafana to InfluxDB
Logged in to the Grafana dashboard, go to “Data Sources” and create a new source pointing to your InfluxDB database, providing the credentials you chose earlier. Example:
Finally, create a new dashboard, create a graph panel, select the freshly created data source and build your first query, presenting the previously injected sine wave time series.
Connecting openHAB to InfluxDB
If everything is set up right and you were able to inject the sine wave into your database, it’s time to do the same from within openHAB. You need to first install the InfluxDB persistence service (via apt, PaperUI or addons.cfg - depending on your system and preferences).
Next, add your InfluxDB connection details to the persistence service config file /etc/openhab2/services/influxdb.cfg:
# The database URL, e.g. http://127.0.0.1:8086 or https://127.0.0.1:8084 .
# Defaults to: http://127.0.0.1:8086
url=http://192.168.0.2:8086

# The name of the database user, e.g. openhab.
# Defaults to: openhab
user=openhab

# The password of the database user.
password=AnotherSuperbPassword456-

# The name of the database, e.g. openhab.
# Defaults to: openhab
db=openhab_db

# The retention policy to be used, needs to configured in InfluxDB
# Till v0.13: 'default', since v1.0: 'autogen'
retentionPolicy=autogen
Finally add a persistence job so openHAB sends your item states to InfluxDB. Add all items or item groups you want to persist including fitting strategies to /etc/openhab2/persitence/influxdb.persist:
Strategies {
    everyMinute : "0 * * * * ?"
    everyHour   : "0 0 * * * ?"
    everyDay    : "0 0 0 * * ?"
}

Items {
    gHeatAct*, gHeatSet*, gHeatValve*   : strategy = everyChange, everyHour
    Presence_Phone                      : strategy = everyChange
}
Regarding strategies: a meaningful usage of these is dependent on the nature of your items and how often they are changed. everyChange is a good strategy with most items (like the power consumption of a washing machine), you might however additionally add a every... for items, that might not be changed for longer times (for example the preset temperature of a room). This is especially important, as Grafana will (by default) only draw graphs for times it has data for. If the preset temperature didn’t change for three hours, there will be no graph for the last three hours ![]()
If everything went well, you should be able, to start selecting your items for a query inside Grafana (after a few minutes to send first values).
Building openHAB Diagrams in Grafana
Grafana offers different panel types and countless displaying options. Your first reference for these should be:
- The official Grafana documentation
- Grafana Graph Panel documentation
- Grafana InfluxDB specific documentation
That said, I want to point out a few options probably interesting for you.
Selection/Aggregation Functions
InfluxDB provides a set of functions that influence what is returned and therefore presented by Grafana. To understand these, you first need to understand the concept behind “GROUP BY”.
Simplified, this means Grafana is asking for a summarized portion of your data over time. Why? Imagine you have an item with a new data point every 5 minutes and a Grafana graph of the with of 300px. What will be be presented in a graph covering the time windows of one full year? With 300 pixels you do not even have one pixel per day, not to mention a few minutes. InfluxDB and Grafana solve this task by breaking down your data into time intervals, represented by $interval in Grafana.
By the help of functions, you can decide which or how data inside one time interval is supposed to be handled. I’ll give one example representing power consumed by a fridge:
Looking at the graph, you can see the red line, using the default mean()ⁱ aggregation function suffers of irritating peaks. While not being wrong, it’s easy to filter them out and by that flattening the visually visible graph. The two possibilities percentile(80) ⁱ and min() ⁱ are shown with good success in this example, other data series might behave differently under them.
Another query shows the usage of moving_average(500) ⁱ. I found this useful in the example as the steps in the consumption, created by the on-off-on-off behavior of the fridge, are quite irritation when mixed with other consumptions by other devices.
Usage of all these options is of course up to you.
Display Options
Under Display there are a few options to modify how your metrics will be presented.
A short selection discussed:
-
Staircase: By default, data points are connected by a point-to-point line. This option will draw constant horizontal lines with a step at the next data point, making this option important for all kinds of discrete dataseries (e.g. on-off states or preset temperatures in 1 degree steps)
-
Stack: Data sets will be stacked instead of drawn in front of each other. This is useful for data like power consumption.
Series specific overrides
Under “Display” the series specific overrides option can be found as well. This option allows one to vary display options among series of one graph. Do not underestimate the possibilities.
Left and Right Y-Axis
I want to mention the possibility to use two y-axis to present data series with two independent value ranges and units. The y-axis can be set via series override or (conveniently) by clicking in the colored legend bar of the series:

In the following example you can see this in action. While Downlink and Uplink (in megabit per second) are linked to the left y-axis, ping (in milliseconds) uses the right y-axis.
Two more things can be seen:
- a series specific override for ping introduces points for this one series, drawing attention to it
- the y-min and y-max of the right axis have been fixed to 0-100ms, in order to shrink the ping distribution to the mid area of the graph
Showing diagrams in your openHAB sitemap
Item data is stored in an InfluxDB datastore and graphs are drawn by Grafana. To make this guide complete, let’s have a look at how you can export your graphs back into your openHAB system as a sitemap element.
…as ‘Image’ Element
We will be exporting Grafana graphs as .png files and display them by the help of the image element on your sitemap.
To generate the URL to your graphs png file, open the graphs Share dialog:

Followed by clicking the “Direct link rendered image” button.
You will be presented with a static graph only view. The URL in the address bar is the information we are looking for. Pay attention to the fact, that there are a few parameters you can (and should) tune directly in the URL:
http://monitoring-host:3000/render/dashboard-solo/db/mydashboard?panelId=5&width=700&height=350&from=now-48h&to=now
                                                     ⁻⁻⁻⁻⁻⁻⁻⁻⁻⁻⁻⁻        ⁻       ⁻⁻⁻        ⁻⁻⁻      ⁻⁻⁻⁻⁻⁻⁻    ⁻⁻⁻
- dashboardname + panelID: the dashboard and panel to export
- width + height: resolution of the exported image
- from + to: the timespan to display.
Hint: Grafana by default generated share URLs with absolute timestamps but relative dates like “now-2d” can be used as well, just like in the frontend time selector!
Our last step is to include the image in our sitemap. It’s as easy as:
Image refresh=60000 url="http://monitoring-host:3000/render/dashboard-solo/db/mydashboard?panelId=5&width=700&height=350&from=now-48h&to=now"
One last remark: If the image is not loaded by openHAB, openHAB probably doesn’t have the permission to do so without login. The easiest solution is to allow anonymous read access, as described above.
Anonymous access is of course only acceptable if you are okay with the public being potentially able to look at your data or if your monitoring-host is in your personal trusted subnet behind a firewall.
If you found a clean solution to allow openHAB to access graphs by the help of login credentials, please let us know!
…as ‘Webview’ Element
Thanks to @pahansen for suggesting this great alternative solution, utilizing a custom html view instead of a pseudo-static image. This solution has a few benefits compared to the ‘Image’ solution above.
Attention: The above solution is known to not work with the openHAB Android app. In order to show the dynamic graph all interfaces you need to set an absolute path as URL. e.g.:
Webview url="http://YOURIP:YOURPORT/static/chartsHour.html"
…as dynamic ‘Webview’ Element with JavaScript library
If you want to display differently parametrized views of graphs, normally a lot of Webview elements are required, which will only be presented based on certain conditions though the visibility[..] expressions. Your browser or client will always load these hidden Webviews, even though they are not visible. As a result, page load times will suffer, especially in combination with weak hardware like the RPi3 or with mobile devices.
@wborn has created a JavaScript library that uses the openHAB 2 REST API and server side events (SSE) to resolve items values to Grafana panel parameters. By that, it’s possible to reduce the number of Webview elements and to make graph generation more customizable directly from inside openHAB.
The code including documentation and an example demo is available at:
…inside HABPanel
Grafana diagrams can of course also be embedded in HABPanel. In fact, you can simply embed a dynamic view of your graphs. Create a new frame widget and use the Embed Sharing option of Grafana to generate the URL to include.
Persistance Data Migration
When you start using InfluxDB to store your data you might want to migrate old data from another persistance service like rrd4j to the new database.
Otherwise the new charts will only start from the time you started using InflluxDB.
@christoph_wempe developed a little bash script, which reads the available data via REST and imports the data to InfluxDB. Find all further details at:
Examples
Grafana graphs and configuration tips can be found all over the the internet. Also be sure to scroll through the comments here to find openHAB graphs by other users.
Feel free to post your screenshots! ![]()
InfluxDB database and measurement hacks
Renaming measurements
If you are changing the name of an item that has been persistent by InfluxDB+Grafana or if you replace one with another for the same purpose, you might want to continue using the one measurement time series. Renaming a measurement is not possible but you can do the following:
In your InfluxDB console:
USE openhab_db
SELECT * INTO new_measurement FROM old_measurement
DROP MEASUREMENT old_measurement

/* Check the result */
SELECT * FROM old_measurement
SELECT * FROM new_measurement
Deleting invalid measurements
Deleting parts of a measurements might be useful, for example when the value send by openHAB resulted out of an error and is not a correct measurement.
In your InfluxDB console:
USE openhab_db

/* First search for the measurements you are looking for */
SELECT * FROM my_measurement WHERE value = 0
SELECT * FROM my_measurement WHERE time >= '2016-07-25T00:00:00Z' AND time <= '2016-07-27T00:00:00Z'

/* Delete what you do not like */
/* either by using the search from above (careful) or by using the unique timestamp */
DELETE FROM my_measurement WHERE value = 0
DELETE FROM my_measurement WHERE time = 1469484042447000000


